Duke Energy 2013 Annual Report Download - page 18
Download and view the complete annual report
Please find page 18 of the 2013 Duke Energy annual report below. You can navigate through the pages in the report by either clicking on the pages listed below, or by using the keyword search tool below to find specific information within the annual report.-
 1
1 -
2
-
3
-
4
-
5
-
6
-
7
-
 8
8 -
 9
9 -
 10
10 -
 11
11 -
 12
12 -
 13
13 -
 14
14 -
 15
15 -
 16
16 -
 17
17 -
 18
18 -
 19
19 -
 20
20 -
 21
21 -
 22
22 -
 23
23 -
 24
24 -
 25
25 -
 26
26 -
 27
27 -
 28
28 -
29
-
30
-
31
-
32
-
33
-
34
-
35
-
36
-
37
-
38
-
39
-
40
-
41
-
42
-
43
-
44
-
45
-
46
-
47
-
48
-
49
-
50
-
51
-
52
-
53
-
54
-
55
-
56
-
57
-
58
-
59
-
60
-
61
-
62
-
63
-
64
-
65
-
66
-
67
-
68
-
69
-
70
-
71
-
72
-
73
-
74
-
75
-
76
-
77
-
78
-
79
-
80
-
81
-
82
-
83
-
84
-
85
-
86
-
87
-
88
-
89
-
90
-
91
-
92
-
93
-
94
-
95
-
96
-
97
-
98
-
99
-
100
-
101
-
102
-
103
-
104
-
105
-
106
-
107
-
108
-
109
-
110
-
111
-
112
-
113
-
114
-
115
-
116
-
117
-
118
-
119
-
120
-
121
-
122
-
123
-
124
-
125
-
126
-
127
-
128
-
129
-
130
-
131
-
132
-
133
-
134
-
135
-
136
-
137
-
138
-
139
-
140
-
141
-
142
-
143
-
144
-
145
-
146
-
147
-
148
-
149
-
150
-
151
-
152
-
153
-
154
-
155
-
156
-
157
-
158
-
159
-
160
-
161
-
162
-
163
-
164
-
165
-
166
-
167
-
168
-
169
-
170
-
171
-
172
-
173
-
174
-
175
-
176
-
177
-
178
-
179
-
180
-
181
-
182
-
183
-
184
-
185
-
186
-
187
-
188
-
189
-
190
-
191
-
192
-
193
-
194
-
195
-
196
-
197
-
198
-
199
-
200
-
201
-
202
-
203
-
204
-
205
-
206
-
207
-
208
-
209
-
210
-
211
-
212
-
213
-
214
-
215
-
216
-
217
-
218
-
219
-
220
-
221
-
222
-
223
-
224
-
225
-
226
-
227
-
228
-
229
-
230
-
231
-
232
-
233
-
234
-
235
-
236
-
237
-
238
-
239
-
240
-
241
-
242
-
243
-
244
-
245
-
246
-
247
-
248
-
249
-
250
-
251
-
252
-
253
-
254
-
255
-
256
-
257
-
258
-
259
 |
 |

Duke Energy’s 2013 Annual Report also references Duke Energy’s
forecasted adjusted diluted EPS outlook range of $4.45 - $4.60 per share.
The materials also reference the long-term targeted range of growth of
4 p cent-6er percent in adjusted diluted EPS (on a compound annual growth
rate (“CAGR”) basis). Due to the forward-looking nature of this non-GAAP
financial measure for future periods, information to reconcile it to the most
directly comparable GAAP financial measure is not available at this time,
as management is unable to project all special items or mark-to-market
adjustments for future periods. The earnings guidance range assumptions for
2014 include a full year of earnings contributions from the Midwest generation
fleet, which management has begun a process to exit. Irrespective of whether
this business is reclassified as discontinued operations for accounting
purposes, management expects to continue including any Midwest generation
fleet earnings in adjusted earnings, adjusted diluted EPS, and adjusted segment
income. Management believes it is unlikely a sale transaction will close in 2014.
Dividend Payout Ratio
Duke Energy’s 2013 Annual Report includes a discussion of Duke
Energy’s anticipated long-term dividend payout ratio of 65 percent-70 percent
based upon adjusted diluted EPS. This payout ratio is a non-GAAP financial
measure as it is based upon forecasted diluted EPS from continuing operations
attributable to Duke Energy Corporation shareholders, adjusted for the per-share
impact of special items and the mark-to-market impacts of economic hedges
in the Commercial Power segment, as discussed above under “Adjusted Diluted
Earnings Per Share (“EPS”)”. The most directly comparable GAAP measure
for adjusted diluted EPS is reported diluted EPS from continuing operations
attributable to Duke Energy Corporation common shareholders, which includes
the impact of special items and the mark-to-market impacts of economic
hedges in the Commercial Power segment. Due to the forward-looking nature
of this non-GAAP financial measure for future periods, information to reconcile
it to the most directly comparable GAAP financial measure is not available at
this time, as management is unable to project special items or mark-to-market
adjustments for future periods.
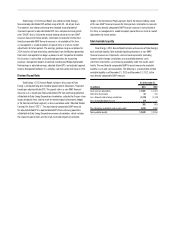
Total Available Liquidity
Duke Energy’s 2013 Annual Report includes a discussion of Duke Energy’s
total available liquidity. Total available liquidity presented is a non-GAAP
financial measure as it represents cash and cash equivalents (excluding
amounts held in foreign jurisdictions and unavailable domestic cash),
short-term investments, and remaining availability under the master credit
facility. The most directly comparable GAAP financial measure for available
liquidity is cash and cash equivalents. The following is a reconciliation of total
available liquidity as of December 31, 2013 and December 31, 2012, to the
most directly comparable GAAP measure:
As of December 31,
(in millions) 2013 2012
Cash and cash equivalents $ 1,501 $ 1,424
Short-term investments 44 333
Less: Amounts held in foreign jurisdictions (1,139) (1,104)
Less: Unavailable domestic cash (24) —
382 653
Plus: Remaining availability under master credit 5,248 4,900
Total available liquidity $ 5,630 $ 5,553