Duke Energy 2013 Annual Report Download - page 40
Download and view the complete annual report
Please find page 40 of the 2013 Duke Energy annual report below. You can navigate through the pages in the report by either clicking on the pages listed below, or by using the keyword search tool below to find specific information within the annual report.-
 1
1 -
2
-
3
-
4
-
5
-
6
-
7
-
8
-
9
-
10
-
11
-
12
-
13
-
14
-
15
-
16
-
17
-
18
-
19
-
20
-
21
-
22
-
23
-
24
-
25
-
26
-
27
-
28
-
29
-
 30
30 -
 31
31 -
 32
32 -
 33
33 -
 34
34 -
 35
35 -
 36
36 -
 37
37 -
 38
38 -
 39
39 -
 40
40 -
 41
41 -
 42
42 -
 43
43 -
 44
44 -
 45
45 -
 46
46 -
 47
47 -
 48
48 -
 49
49 -
 50
50 -
51
-
52
-
53
-
54
-
55
-
56
-
57
-
58
-
59
-
60
-
61
-
62
-
63
-
64
-
65
-
66
-
67
-
68
-
69
-
70
-
71
-
72
-
73
-
74
-
75
-
76
-
77
-
78
-
79
-
80
-
81
-
82
-
83
-
84
-
85
-
86
-
87
-
88
-
89
-
90
-
91
-
92
-
93
-
94
-
95
-
96
-
97
-
98
-
99
-
100
-
101
-
102
-
103
-
104
-
105
-
106
-
107
-
108
-
109
-
110
-
111
-
112
-
113
-
114
-
115
-
116
-
117
-
118
-
119
-
120
-
121
-
122
-
123
-
124
-
125
-
126
-
127
-
128
-
129
-
130
-
131
-
132
-
133
-
134
-
135
-
136
-
137
-
138
-
139
-
140
-
141
-
142
-
143
-
144
-
145
-
146
-
147
-
148
-
149
-
150
-
151
-
152
-
153
-
154
-
155
-
156
-
157
-
158
-
159
-
160
-
161
-
162
-
163
-
164
-
165
-
166
-
167
-
168
-
169
-
170
-
171
-
172
-
173
-
174
-
175
-
176
-
177
-
178
-
179
-
180
-
181
-
182
-
183
-
184
-
185
-
186
-
187
-
188
-
189
-
190
-
191
-
192
-
193
-
194
-
195
-
196
-
197
-
198
-
199
-
200
-
201
-
202
-
203
-
204
-
205
-
206
-
207
-
208
-
209
-
210
-
211
-
212
-
213
-
214
-
215
-
216
-
217
-
218
-
219
-
220
-
221
-
222
-
223
-
224
-
225
-
226
-
227
-
228
-
229
-
230
-
231
-
232
-
233
-
234
-
235
-
236
-
237
-
238
-
239
-
240
-
241
-
242
-
243
-
244
-
245
-
246
-
247
-
248
-
249
-
250
-
251
-
252
-
253
-
254
-
255
-
256
-
257
-
258
-
259
 |
 |

PART I
22
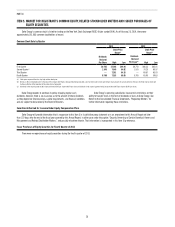
The following table provides information related to Regulated Utilities’ electric transmission and distribution properties as of December 31, 2013.
Duke
Energy
Carolinas
Duke
Energy
Progress
Duke
Energy
Florida
Duke
Energy
Ohio
Duke
Energy
Indiana
Total
Regulated
Utilities
Electric Transmission Lines
Miles of 525 KV 600 300 200 — — 1,100
Miles of 345 KV — — — 1,000 700 1,700
Miles of 230 KV 2,600 3,300 1,700 — 700 8,300
Miles of 100 to 161 KV 6,800 2,600 1,000 700 1,400 12,500
Miles of 13 to 69 KV 3,100 — 2,300 800 2,500 8,700
Total conductor miles of electric transmission lines 13,100 6,200 5,200 2,500 5,300 32,300
Electric Distribution Lines
Miles of overhead lines 66,700 44,600 24,100 13,800 22,500 171,700
Miles of underground line 35,600 23,000 17,300 5,700 8,400 90,000
Total conductor miles of electric distribution lines 102,300 67,600 41,400 19,500 30,900 261,700
Number of electric transmission and distribution substations 1,500 500 500 300 500 3,300
Miles of gas mains — — — 7,200 — 7,200
Miles of gas service lines — — — 6,100 — 6,100
Substantially all of Regulated Utilities’ electric plant in service are mortgaged under indentures relating to Duke Energy Carolinas’, Duke Energy Progress’, Duke
Energy Florida’s, Duke Energy Ohio’s and Duke Energy Indiana’s various series of First Mortgage Bonds.
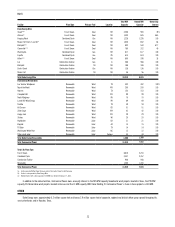
INTERNATIONAL ENERGY
The following table provides additional information related to International Energy’s electric generation stations as of December 31, 2013. The MW displayed in
the table below are based on summer capacity.
Facility Primary Fuel Location
Total MW
Capacity
Owned MW
Capacity
Ownership
Interest
Paranapanema(a) Water Brazil 2,275 2,089
92 %
Egenor Water/Diesel Peru 622 622
100
Cerros Colorados Water/Gas Argentina 576 524
91
DEI Chile Water/Diesel/Gas Chile 380 380
100
DEI El Salvador Oil/Diesel El Salvador 328 296
90
DEI Guatemala Oil/Diesel/Coal Guatemala 356 356
100
Electroquil Diesel Ecuador 192 163
85
Aguaytia Gas Peru 170 170
100
Total International Energy 4,899 4,600
(a) Includes Canoas I and II, which are jointly owned with Companhia Brasileira de Aluminio, as well as the wholly owned Palmeiras and Retiro small hydro plants.
International Energy also owns a 25 percent equity interest in NMC. In 2013, NMC produced approximately 800,000 metric tons of methanol and approximately
1 million metric tons of MTBE. Approximately 40 percent of methanol is normally used in the MTBE production.
COMMERCIAL POWER
The following table provides information related to Commercial Power’s electric generation stations as of December 31, 2013. The MW displayed in the table
below are based on summer capacity.