Duke Energy 2013 Annual Report Download - page 62
Download and view the complete annual report
Please find page 62 of the 2013 Duke Energy annual report below. You can navigate through the pages in the report by either clicking on the pages listed below, or by using the keyword search tool below to find specific information within the annual report.-
 1
1 -
2
-
3
-
4
-
5
-
6
-
7
-
8
-
9
-
10
-
11
-
12
-
13
-
14
-
15
-
16
-
17
-
18
-
19
-
20
-
21
-
22
-
23
-
24
-
25
-
26
-
27
-
28
-
29
-
30
-
31
-
32
-
33
-
34
-
35
-
36
-
37
-
38
-
39
-
40
-
41
-
42
-
43
-
44
-
45
-
46
-
47
-
48
-
49
-
50
-
51
-
 52
52 -
 53
53 -
 54
54 -
 55
55 -
 56
56 -
 57
57 -
 58
58 -
 59
59 -
 60
60 -
 61
61 -
 62
62 -
 63
63 -
 64
64 -
 65
65 -
 66
66 -
 67
67 -
 68
68 -
 69
69 -
 70
70 -
 71
71 -
 72
72 -
73
-
74
-
75
-
76
-
77
-
78
-
79
-
80
-
81
-
82
-
83
-
84
-
85
-
86
-
87
-
88
-
89
-
90
-
91
-
92
-
93
-
94
-
95
-
96
-
97
-
98
-
99
-
100
-
101
-
102
-
103
-
104
-
105
-
106
-
107
-
108
-
109
-
110
-
111
-
112
-
113
-
114
-
115
-
116
-
117
-
118
-
119
-
120
-
121
-
122
-
123
-
124
-
125
-
126
-
127
-
128
-
129
-
130
-
131
-
132
-
133
-
134
-
135
-
136
-
137
-
138
-
139
-
140
-
141
-
142
-
143
-
144
-
145
-
146
-
147
-
148
-
149
-
150
-
151
-
152
-
153
-
154
-
155
-
156
-
157
-
158
-
159
-
160
-
161
-
162
-
163
-
164
-
165
-
166
-
167
-
168
-
169
-
170
-
171
-
172
-
173
-
174
-
175
-
176
-
177
-
178
-
179
-
180
-
181
-
182
-
183
-
184
-
185
-
186
-
187
-
188
-
189
-
190
-
191
-
192
-
193
-
194
-
195
-
196
-
197
-
198
-
199
-
200
-
201
-
202
-
203
-
204
-
205
-
206
-
207
-
208
-
209
-
210
-
211
-
212
-
213
-
214
-
215
-
216
-
217
-
218
-
219
-
220
-
221
-
222
-
223
-
224
-
225
-
226
-
227
-
228
-
229
-
230
-
231
-
232
-
233
-
234
-
235
-
236
-
237
-
238
-
239
-
240
-
241
-
242
-
243
-
244
-
245
-
246
-
247
-
248
-
249
-
250
-
251
-
252
-
253
-
254
-
255
-
256
-
257
-
258
-
259
 |
 |

44
PART II
Partially offset by:
• A $42 million decrease in regulated fuel expense driven primarily by
lower purchased power expense and reduced volumes, partially offset by
higher fuel costs.
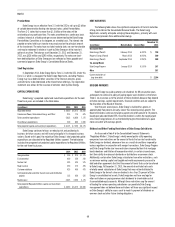
Other Income and Expenses, net. The decrease was primarily due to
lower AFUDC equity and lower interest income.
Interest Expense. The decrease was primarily due to lower average debt
balances in 2013 compared to 2012.
Income Tax Expense. The variance was primarily due to a decrease
in pretax income. The effective tax rates for the years ended December 31,
2013 and 2012 were 42.2 percent and 36 percent, respectively. The change in
the effective tax rate was primarily due to a decrease in pretax income and a
decrease in the manufacturing deduction in 2013.
Matters Impacting Future Duke Energy Ohio Results
On February 17, 2014, Duke Energy Ohio announced that it had initiated
a process to exit its nonregulated Midwest generation business. Considering
a marketing period of several months and potential regulatory approvals,
Duke Energy Ohio expects to dispose of the nonregulated Midwest generation
business by early to mid-2015. In the first quarter of 2014, Duke Energy Ohio
will reclassify approximately $3.5 billion carrying value of its Midwest generation
business to assets held for sale and expects to record an estimated pretax
impairment charge of $1 billion to $2 billion to reduce the carrying value to
estimated sales proceeds less cost to sell.
In 2013, a FERC Administrative Law Judge issued an initial decision
holding that Duke Energy Ohio is responsible for certain MVP costs, a type of
MTEP cost, approved by MISO prior to the date of Duke Energy Ohio’s withdrawal.
The initial decision will be reviewed by FERC. If FERC upholds the initial decision,
Duke Energy Ohio intends to file an appeal in federal court. If Duke Energy Ohio
ultimately is found to be responsible for these costs, a portion of these costs
may not be eligible for recovery, resulting in an adverse impact to its financial
position, results of operations and cash flows. See Note 4 to the Consolidated
Financial Statements, “Regulatory Matters,” for additional information.
DUKE ENERGY INDIANA
Introduction
Management’s Discussion and Analysis should be read in conjunction with
the accompanying Consolidated Financial Statements and Notes for the years
ended December 31, 2013, 2012, and 2011.
Basis of Presentation
The results of operations and variance discussion for Duke Energy
Indiana is presented in a reduced disclosure format in accordance with General
Instruction (I)(2)(a) of Form 10-K.
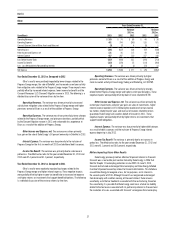
Results of Operations
Years Ended December 31,
(in millions) 2013 2012 Variance
Operating Revenues $2,926 $ 2,717 $ 209
Operating Expenses 2,193 2,792 (599)
Operating Income (Loss) 733 (75) 808
Other Income and Expense, net 18 90 (72)
Interest Expense 170 138 32
Income (Loss) Before Income Taxes 581 (123) 704
Income Tax Expense (Benefit) 223 (73) 296
Net Income (Loss) $ 358 $ (50) $ 408
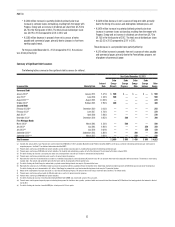
The following table shows the percent changes in GWh sales and average number of customers for Duke Energy Indiana. The below percentages for retail
customer classes represent billed sales only. Total sales includes billed and unbilled retail sales, and wholesale sales to incorporated municipalities and to public and
private utilities and power marketers. Amounts are not weather normalized.
Increase (decrease) over prior year 2013 2012
Residential sales 3.2 % (4.8)%
General service sales 0.5 % (0.5)%
Industrial sales (0.3)% 1.7 %
Wholesale power sales (1.4)% 7.9 %
Total sales 0.4 % 1.2 %
Average number of customers 0.7 % 0.6 %