Duke Energy 2013 Annual Report Download - page 175
Download and view the complete annual report
Please find page 175 of the 2013 Duke Energy annual report below. You can navigate through the pages in the report by either clicking on the pages listed below, or by using the keyword search tool below to find specific information within the annual report.-
 1
1 -
2
-
3
-
4
-
5
-
6
-
7
-
8
-
9
-
10
-
11
-
12
-
13
-
14
-
15
-
16
-
17
-
18
-
19
-
20
-
21
-
22
-
23
-
24
-
25
-
26
-
27
-
28
-
29
-
30
-
31
-
32
-
33
-
34
-
35
-
36
-
37
-
38
-
39
-
40
-
41
-
42
-
43
-
44
-
45
-
46
-
47
-
48
-
49
-
50
-
51
-
52
-
53
-
54
-
55
-
56
-
57
-
58
-
59
-
60
-
61
-
62
-
63
-
64
-
65
-
66
-
67
-
68
-
69
-
70
-
71
-
72
-
73
-
74
-
75
-
76
-
77
-
78
-
79
-
80
-
81
-
82
-
83
-
84
-
85
-
86
-
87
-
88
-
89
-
90
-
91
-
92
-
93
-
94
-
95
-
96
-
97
-
98
-
99
-
100
-
101
-
102
-
103
-
104
-
105
-
106
-
107
-
108
-
109
-
110
-
111
-
112
-
113
-
114
-
115
-
116
-
117
-
118
-
119
-
120
-
121
-
122
-
123
-
124
-
125
-
126
-
127
-
128
-
129
-
130
-
131
-
132
-
133
-
134
-
135
-
136
-
137
-
138
-
139
-
140
-
141
-
142
-
143
-
144
-
145
-
146
-
147
-
148
-
149
-
150
-
151
-
152
-
153
-
154
-
155
-
156
-
157
-
158
-
159
-
160
-
161
-
162
-
163
-
164
-
 165
165 -
 166
166 -
 167
167 -
 168
168 -
 169
169 -
 170
170 -
 171
171 -
 172
172 -
 173
173 -
 174
174 -
 175
175 -
 176
176 -
 177
177 -
 178
178 -
 179
179 -
 180
180 -
 181
181 -
 182
182 -
 183
183 -
 184
184 -
 185
185 -
186
-
187
-
188
-
189
-
190
-
191
-
192
-
193
-
194
-
195
-
196
-
197
-
198
-
199
-
200
-
201
-
202
-
203
-
204
-
205
-
206
-
207
-
208
-
209
-
210
-
211
-
212
-
213
-
214
-
215
-
216
-
217
-
218
-
219
-
220
-
221
-
222
-
223
-
224
-
225
-
226
-
227
-
228
-
229
-
230
-
231
-
232
-
233
-
234
-
235
-
236
-
237
-
238
-
239
-
240
-
241
-
242
-
243
-
244
-
245
-
246
-
247
-
248
-
249
-
250
-
251
-
252
-
253
-
254
-
255
-
256
-
257
-
258
-
259
 |
 |

157
PART II
DUKE ENERGY CORPORATION • DUKE ENERGY CAROLINAS, LLC • PROGRESS ENERGY, INC. •
DUKE ENERGY PROGRESS, INC. • DUKE ENERGY FLORIDA, INC. • DUKE ENERGY OHIO, INC. • DUKE ENERGY INDIANA, INC.
Combined Notes to Consolidated Financial Statements – (Continued)
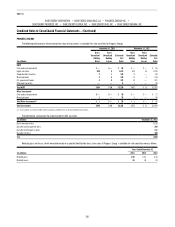
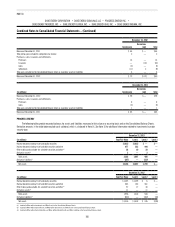
DUKE ENERGY CAROLINAS
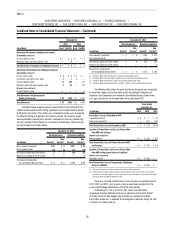
The following table presents the estimated fair value of investments in available-for-sale securities.
December 31, 2013 December 31, 2012
(in millions)
Gross
Unrealized
Holding
Gains
Gross
Unrealized
Holding
Losses
Estimated
Fair
Value
Gross
Unrealized
Holding
Gains
Gross
Unrealized
Holding
Losses
Estimated
Fair
Value
NDTF
Cash and cash equivalents $ — $— $ 42 $ — $ — $ 40
Equity securities 974 6 1,964 600 5 1,592
Corporate debt securities 5 5 274 11 1 250
Municipal bonds — 2 54 2 — 40
U.S. government bonds 3 7 354 10 — 304
Other debt securities 22 2 146 9 2 135
Total NDTF $ 1,004 $ 22 $ 2,834 $ 632 $ 8 $ 2,361
Other Investments
Other debt securities — 1 3 — 1 3
Total Other Investments(a) $ — $ 1 $ 3 $ — $ 1 $ 3
Total Investments $1,004 $ 23 $ 2,837 $ 632 $ 9 $2,364
(a) These amounts are recorded in Other within Investments and Other Assets on the Consolidated Balance Sheets.
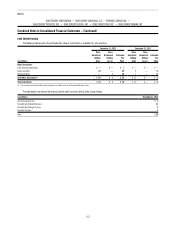
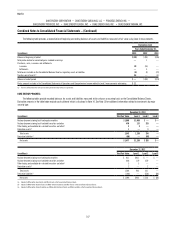
The table below summarizes the maturity date for debt securities.
(in millions) December 31, 2013
Due in one year or less $ 18
Due after one through five years 167
Due after five through 10 years 239
Due after 10 years 407
Total $831
Realized gains and losses, which were determined on a specific identification basis, from sales of Duke Energy Carolinas’ available-for-sale securities were
as follows.
Years Ended December 31,
(in millions) 2013 2012 2011
Realized gains $115 $ 89 $ 71
Realized losses 12 6 35