Duke Energy 2013 Annual Report Download - page 158
Download and view the complete annual report
Please find page 158 of the 2013 Duke Energy annual report below. You can navigate through the pages in the report by either clicking on the pages listed below, or by using the keyword search tool below to find specific information within the annual report.-
 1
1 -
2
-
3
-
4
-
5
-
6
-
7
-
8
-
9
-
10
-
11
-
12
-
13
-
14
-
15
-
16
-
17
-
18
-
19
-
20
-
21
-
22
-
23
-
24
-
25
-
26
-
27
-
28
-
29
-
30
-
31
-
32
-
33
-
34
-
35
-
36
-
37
-
38
-
39
-
40
-
41
-
42
-
43
-
44
-
45
-
46
-
47
-
48
-
49
-
50
-
51
-
52
-
53
-
54
-
55
-
56
-
57
-
58
-
59
-
60
-
61
-
62
-
63
-
64
-
65
-
66
-
67
-
68
-
69
-
70
-
71
-
72
-
73
-
74
-
75
-
76
-
77
-
78
-
79
-
80
-
81
-
82
-
83
-
84
-
85
-
86
-
87
-
88
-
89
-
90
-
91
-
92
-
93
-
94
-
95
-
96
-
97
-
98
-
99
-
100
-
101
-
102
-
103
-
104
-
105
-
106
-
107
-
108
-
109
-
110
-
111
-
112
-
113
-
114
-
115
-
116
-
117
-
118
-
119
-
120
-
121
-
122
-
123
-
124
-
125
-
126
-
127
-
128
-
129
-
130
-
131
-
132
-
133
-
134
-
135
-
136
-
137
-
138
-
139
-
140
-
141
-
142
-
143
-
144
-
145
-
146
-
147
-
 148
148 -
 149
149 -
 150
150 -
 151
151 -
 152
152 -
 153
153 -
 154
154 -
 155
155 -
 156
156 -
 157
157 -
 158
158 -
 159
159 -
 160
160 -
 161
161 -
 162
162 -
 163
163 -
 164
164 -
 165
165 -
 166
166 -
 167
167 -
 168
168 -
169
-
170
-
171
-
172
-
173
-
174
-
175
-
176
-
177
-
178
-
179
-
180
-
181
-
182
-
183
-
184
-
185
-
186
-
187
-
188
-
189
-
190
-
191
-
192
-
193
-
194
-
195
-
196
-
197
-
198
-
199
-
200
-
201
-
202
-
203
-
204
-
205
-
206
-
207
-
208
-
209
-
210
-
211
-
212
-
213
-
214
-
215
-
216
-
217
-
218
-
219
-
220
-
221
-
222
-
223
-
224
-
225
-
226
-
227
-
228
-
229
-
230
-
231
-
232
-
233
-
234
-
235
-
236
-
237
-
238
-
239
-
240
-
241
-
242
-
243
-
244
-
245
-
246
-
247
-
248
-
249
-
250
-
251
-
252
-
253
-
254
-
255
-
256
-
257
-
258
-
259
 |
 |

140
PART II
DUKE ENERGY CORPORATION • DUKE ENERGY CAROLINAS, LLC • PROGRESS ENERGY, INC. •
DUKE ENERGY PROGRESS, INC. • DUKE ENERGY FLORIDA, INC. • DUKE ENERGY OHIO, INC. • DUKE ENERGY INDIANA, INC.
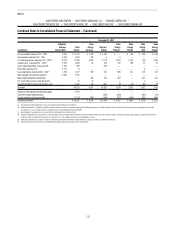
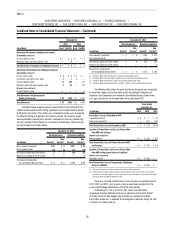
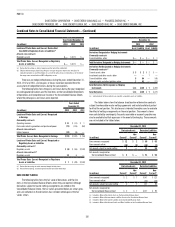
Combined Notes to Consolidated Financial Statements – (Continued)
December 31, 2012
(in millions)
Estimated
Useful Life
(Years)
Duke
Energy
Duke
Energy
Carolinas
Progress
Energy
Duke
Energy
Progress
Duke
Energy
Florida
Duke
Energy
Ohio
Duke
Energy
Indiana
Land $1,368 $378 $618 $380 $239 $136 $90
Plant - Regulated
Electric generation, distribution and transmission 2–138 73,181 29,269 30,250 18,009 12,041 3,774 8,622
Natural gas transmission and distribution 12–60 2,026 — — — — 2,026 —
Other buildings and improvements 2–100 1,319 444 609 283 318 125 149
Plant — Nonregulated
Electric generation, distribution and transmission 2–100 6,055 — — — — 3,870 —
Other buildings and improvements 9–90 2,940 — — — — 191 —
Nuclear fuel 2,127 1,277 850 850 ———
Equipment 1–34 1,448 279 604 336 90 255 141
Construction in process 6,655 1,996 1,424 946 474 204 2,836
Other 5–60 3,272 547 791 380 270 243 174
Total property, plant and equipment(a)(d) 100,391 34,190 35,146 21,184 13,432 10,824 12,012
Total accumulated depreciation — regulated(b)(c)(d) (29,471) (11,437) (12,512) (8,185) (4,072) (1,995) (3,692)
Total accumulated depreciation — nonregulated(c)(d) (2,498) — — — — (703) —
Generation facilities to be retired, net 136 73 63 63 ———
Total net property, plant and equipment $68,558 $22,826 $22,697 $13,062 $9,360 $8,126 $8,320
(a) Includes capitalized leases of $1,844 million, $53 million, $339 million, $150 million, $189 million, $86 million, and $28 million at Duke Energy, Duke Energy Carolinas, Progress Energy, Duke Energy Progress, Duke Energy
Florida, Duke Energy Ohio, and Duke Energy Indiana, respectively, primarily in regulated plant. The Progress Energy, Duke Energy Progress and Duke Energy Florida amounts are net of $49 million, an insignicant amount and
$48 million, respectively, of accumulated amortization of capitalized leases.
(b) Includes $857 million, $557 million, $300 million and $300 million of accumulated amortization of nuclear fuel at Duke Energy, Duke Energy Carolinas, Progress Energy and Duke Energy Progress, respectively.
(c) Includes accumulated amortization of capitalized leases of $34 million, $3 million, $12 million and $5 million at Duke Energy, Duke Energy Carolinas, Duke Energy Ohio and Duke Energy Indiana, respectively.
(d) Includes gross property, plant and equipment cost of consolidated VIEs of $1,558 million and accumulated depreciation of consolidated VIEs of $103 million at Duke Energy.
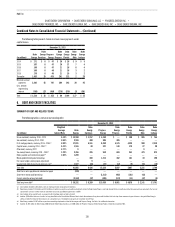
The following table presents capitalized interest, which includes the debt component of AFUDC.
Years Ended December 31,
(in millions) 2013 2012 2011
Duke Energy $90 $177 $166
Duke Energy Carolinas 41 72 78
Progress Energy 19 41 35
Duke Energy Progress 16 23 20
Duke Energy Florida 318 15
Duke Energy Ohio 12 15 9
Duke Energy Indiana 939 33