Duke Energy 2013 Annual Report Download - page 52
Download and view the complete annual report
Please find page 52 of the 2013 Duke Energy annual report below. You can navigate through the pages in the report by either clicking on the pages listed below, or by using the keyword search tool below to find specific information within the annual report.-
 1
1 -
2
-
3
-
4
-
5
-
6
-
7
-
8
-
9
-
10
-
11
-
12
-
13
-
14
-
15
-
16
-
17
-
18
-
19
-
20
-
21
-
22
-
23
-
24
-
25
-
26
-
27
-
28
-
29
-
30
-
31
-
32
-
33
-
34
-
35
-
36
-
37
-
38
-
39
-
40
-
41
-
 42
42 -
 43
43 -
 44
44 -
 45
45 -
 46
46 -
 47
47 -
 48
48 -
 49
49 -
 50
50 -
 51
51 -
 52
52 -
 53
53 -
 54
54 -
 55
55 -
 56
56 -
 57
57 -
 58
58 -
 59
59 -
 60
60 -
 61
61 -
 62
62 -
63
-
64
-
65
-
66
-
67
-
68
-
69
-
70
-
71
-
72
-
73
-
74
-
75
-
76
-
77
-
78
-
79
-
80
-
81
-
82
-
83
-
84
-
85
-
86
-
87
-
88
-
89
-
90
-
91
-
92
-
93
-
94
-
95
-
96
-
97
-
98
-
99
-
100
-
101
-
102
-
103
-
104
-
105
-
106
-
107
-
108
-
109
-
110
-
111
-
112
-
113
-
114
-
115
-
116
-
117
-
118
-
119
-
120
-
121
-
122
-
123
-
124
-
125
-
126
-
127
-
128
-
129
-
130
-
131
-
132
-
133
-
134
-
135
-
136
-
137
-
138
-
139
-
140
-
141
-
142
-
143
-
144
-
145
-
146
-
147
-
148
-
149
-
150
-
151
-
152
-
153
-
154
-
155
-
156
-
157
-
158
-
159
-
160
-
161
-
162
-
163
-
164
-
165
-
166
-
167
-
168
-
169
-
170
-
171
-
172
-
173
-
174
-
175
-
176
-
177
-
178
-
179
-
180
-
181
-
182
-
183
-
184
-
185
-
186
-
187
-
188
-
189
-
190
-
191
-
192
-
193
-
194
-
195
-
196
-
197
-
198
-
199
-
200
-
201
-
202
-
203
-
204
-
205
-
206
-
207
-
208
-
209
-
210
-
211
-
212
-
213
-
214
-
215
-
216
-
217
-
218
-
219
-
220
-
221
-
222
-
223
-
224
-
225
-
226
-
227
-
228
-
229
-
230
-
231
-
232
-
233
-
234
-
235
-
236
-
237
-
238
-
239
-
240
-
241
-
242
-
243
-
244
-
245
-
246
-
247
-
248
-
249
-
250
-
251
-
252
-
253
-
254
-
255
-
256
-
257
-
258
-
259
 |
 |

34
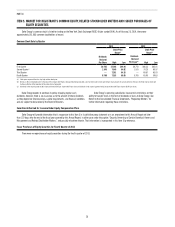
PART II
• An $18 million decrease in Argentina as a result of unfavorable
exchange rates.
Partially offset by:
• A $67 million increase in Brazil due to higher average prices, net of
lower volumes, and
• A $65 million increase in Chile as a result of asset acquisitions in 2012.
Operating Expenses. The variance was driven primarily by:
• A $65 million decrease in Central America due to lower fuel costs,
partially offset by higher purchased power and coal consumption, and
• A $20 million decrease in Brazil due to weakening of the Real to the
U.S. dollar and lower purchased power partially offset by higher variable
costs.
Partially offset by:
• A $36 million increase in Chile as a result of acquisitions in 2012.
Other Income and Expenses, net. The decrease was primarily driven
by a net currency remeasurement loss in Latin America due to strengthening of
the dollar, and lower equity earnings at NMC as a result of lower MTBE average
prices and lower volumes due to extended maintenance, partially offset by lower
butane costs.
Interest Expense. The variance was primarily due to the Chile
acquisitions in 2012, partially offset by favorable exchange rates and lower
inflation in Brazil.
Income Tax Expense. The variance was primarily due to a decrease in
pretax income. The effective tax rates for the years ended December 31, 2013
and 2012 were 28.3 percent and 24.8 percent, respectively. The increase in the
effective tax rate is primarily due to a higher proportion of earnings in countries
with higher tax rates.
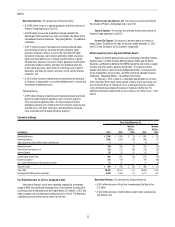
Year Ended December 31, 2012 as Compared to 2011
International Energy’s results were negatively impacted by unfavorable
exchange rates in Brazil, a 2011 Peru arbitration award, and lower margins in
Central America, partially offset by higher average prices and volumes in Brazil
and higher average prices in Peru. The following is a detailed discussion of the
variance drivers by line item.
Operating Revenues. The variance was driven primarily by:
• A $53 million increase in Central America as a result of higher volumes
due to a full year of commercial operations of the Las Palmas II plant
and favorable hydrology,
• A $24 million increase in Peru due to higher average prices, and
• A $10 million increase in Argentina due to higher volumes as a result of
favorable hydrology, partially offset by unfavorable exchange rates.
Operating Expenses. The variance was driven primarily by:
• A $76 million increase in Central America due to higher fuel costs and
consumption as a result of increased dispatch.
Other Income and Expense, net. The variance was primarily driven by
the absence of a $20 million arbitration award in Peru.
Interest Expense. The variance was primarily due to lower capitalized
interest in Central America and Brazil, as well as higher inflation partially offset
by favorable exchange rates in Brazil.
Income Tax Expense. The variance in tax expense is primarily due to a
decrease in pretax income. The effective tax rates for the years ended December
31, 2012 and 2011 were 24.8 percent and 28.9 percent, respectively.