Duke Energy 2013 Annual Report Download - page 54
Download and view the complete annual report
Please find page 54 of the 2013 Duke Energy annual report below. You can navigate through the pages in the report by either clicking on the pages listed below, or by using the keyword search tool below to find specific information within the annual report.-
 1
1 -
2
-
3
-
4
-
5
-
6
-
7
-
8
-
9
-
10
-
11
-
12
-
13
-
14
-
15
-
16
-
17
-
18
-
19
-
20
-
21
-
22
-
23
-
24
-
25
-
26
-
27
-
28
-
29
-
30
-
31
-
32
-
33
-
34
-
35
-
36
-
37
-
38
-
39
-
40
-
41
-
42
-
43
-
 44
44 -
 45
45 -
 46
46 -
 47
47 -
 48
48 -
 49
49 -
 50
50 -
 51
51 -
 52
52 -
 53
53 -
 54
54 -
 55
55 -
 56
56 -
 57
57 -
 58
58 -
 59
59 -
 60
60 -
 61
61 -
 62
62 -
 63
63 -
 64
64 -
65
-
66
-
67
-
68
-
69
-
70
-
71
-
72
-
73
-
74
-
75
-
76
-
77
-
78
-
79
-
80
-
81
-
82
-
83
-
84
-
85
-
86
-
87
-
88
-
89
-
90
-
91
-
92
-
93
-
94
-
95
-
96
-
97
-
98
-
99
-
100
-
101
-
102
-
103
-
104
-
105
-
106
-
107
-
108
-
109
-
110
-
111
-
112
-
113
-
114
-
115
-
116
-
117
-
118
-
119
-
120
-
121
-
122
-
123
-
124
-
125
-
126
-
127
-
128
-
129
-
130
-
131
-
132
-
133
-
134
-
135
-
136
-
137
-
138
-
139
-
140
-
141
-
142
-
143
-
144
-
145
-
146
-
147
-
148
-
149
-
150
-
151
-
152
-
153
-
154
-
155
-
156
-
157
-
158
-
159
-
160
-
161
-
162
-
163
-
164
-
165
-
166
-
167
-
168
-
169
-
170
-
171
-
172
-
173
-
174
-
175
-
176
-
177
-
178
-
179
-
180
-
181
-
182
-
183
-
184
-
185
-
186
-
187
-
188
-
189
-
190
-
191
-
192
-
193
-
194
-
195
-
196
-
197
-
198
-
199
-
200
-
201
-
202
-
203
-
204
-
205
-
206
-
207
-
208
-
209
-
210
-
211
-
212
-
213
-
214
-
215
-
216
-
217
-
218
-
219
-
220
-
221
-
222
-
223
-
224
-
225
-
226
-
227
-
228
-
229
-
230
-
231
-
232
-
233
-
234
-
235
-
236
-
237
-
238
-
239
-
240
-
241
-
242
-
243
-
244
-
245
-
246
-
247
-
248
-
249
-
250
-
251
-
252
-
253
-
254
-
255
-
256
-
257
-
258
-
259
 |
 |

36
PART II
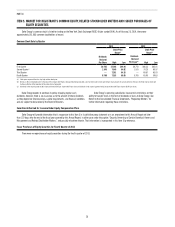
• A $39 million decrease for the gas-fired generation assets driven
primarily by lower power prices, partially offset by increased volumes;
• A $27 million decrease due primarily to the termination of certain non-
core operations at the end of the first quarter of 2011 and a reduction of
coal sales volumes as a result of lower natural gas prices;
• An $18 million decrease in PJM capacity revenues related to lower
average cleared capacity auction pricing in 2012 compared to 2011 for
the gas-fired generation assets, net of an increase associated with the
move of the coal-fired generation assets from Midcontinent Independent
System Operator, Inc. (MISO) to PJM in 2012; and
• An $8 million decrease in net mark-to-market revenues on non-
qualifying power and capacity hedge contracts, consisting of mark-to-
market losses of $6 million in 2012 compared to gains of $2 million in
2011.
Partially offset by:
• A $64 million increase from participation in competitive retail load
auctions; and
• A $17 million increase from higher production in the renewables
portfolio.
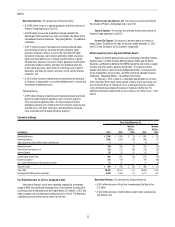
Operating Expenses. The variance was driven primarily by:
• A $140 million decrease in operating and maintenance expenses
resulting primarily from the prior year recognition of MISO exit fees;
lower transmission costs, prior year station outages, and 2011
regulatory asset amortization expenses;
• An $88 million decrease primarily from the 2011 impairment of excess
emission allowances as a result of the EPA’s issuance of the Cross-
State Air Pollution Rule (CSAPR);
• An $85 million decrease in fuel expenses from the gas-fired generation
assets driven by lower natural gas costs, partially offset by increased
volumes;
• A $19 million decrease in fuel used due primarily to the termination of
certain non-core operations at the end of the first quarter of 2011 and
from lower natural gas prices;
• A $15 million decrease due to the receipt of funds in 2012 related to a
previously written-off receivable associated with the Lehman Brothers
bankruptcy;
• A $15 million decrease in purchased power to serve Duke Energy Retail
customers; and
• A $13 million decrease in fuel used for the coal-fired generation assets
driven primarily by lower generation volumes.
Partially offset by:
• A $54 million increase in purchased power to serve competitive retail
load auctions.
Other Income and Expense, net. The variance is primarily due to the
sale of certain Duke Energy Generation Services, Inc. (DEGS) operations and
higher equity earnings from the renewables portfolio.
Interest Expense. The variance is primarily due to higher capitalized
interest on wind construction projects.
Income Tax Benefit. The variance in tax benefit is primarily due to
a decrease in pretax income. The effective tax rates for the years ended
December 31, 2012 and 2011 were (9.5) percent and (1.4) percent, respectively.
Matters Impacting Future Commercial Power Results
On February 17, 2014, Commercial Power announced that it had initiated
a process to exit its nonregulated Midwest generation business. Considering
a marketing period of several months and potential regulatory approvals,
Commercial Power expects to dispose of the nonregulated Midwest generation
business by early to mid-2015. In the first quarter of 2014, Commercial Power
will reclassify approximately $3.5 billion carrying value of its Midwest generation
business to assets held for sale and expects to record an estimated pretax
impairment charge of $1 billion to $2 billion to reduce the carrying value to
estimated sales proceeds less cost to sell.
In 2013, a FERC Administrative Law Judge issued an initial decision
holding that Commercial Power is responsible for certain MVP costs, a type of
Transmission Expansion Planning (MTEP) cost, approved by MISO prior to the
date of Commercial Power’s withdrawal. The initial decision will be reviewed
by FERC. If FERC upholds the initial decision, Commercial Power intends to
file an appeal in federal court. If Commercial Power ultimately is found to be
responsible for these costs, a portion of these costs may not be eligible for
recovery, resulting in an adverse impact to its financial position, results of
operations and cash flows. See Note 4 to the Consolidated Financial Statements,
“Regulatory Matters,” for additional information.
Changes or variability in assumptions used in calculating fair value of the
renewables reporting unit for goodwill testing purposes including but not limited
to, legislative actions related to tax credit extensions, long-term growth rates
and discount rates, could significantly impact the estimated fair value of the
renewables reporting unit. In the event of a significant decline in the estimated
fair value of the renewables reporting unit, goodwill and other asset impairment
charges could be recorded. The carrying value of goodwill and intangible assets
associated with proposed renewable projects within Commercial Power’s
renewables reporting unit was approximately $84 million at December 31,
2013. In addition, management periodically reviews individual projects within
Commercial Power’s renewables portfolio to evaluate ongoing alignment with the
strategic direction of the business. A determination that a project is no longer
consistent with the business strategy and a decision to divest of a project or
projects could result in an impairment charge.