Duke Energy 2013 Annual Report Download - page 55
Download and view the complete annual report
Please find page 55 of the 2013 Duke Energy annual report below. You can navigate through the pages in the report by either clicking on the pages listed below, or by using the keyword search tool below to find specific information within the annual report.-
 1
1 -
2
-
3
-
4
-
5
-
6
-
7
-
8
-
9
-
10
-
11
-
12
-
13
-
14
-
15
-
16
-
17
-
18
-
19
-
20
-
21
-
22
-
23
-
24
-
25
-
26
-
27
-
28
-
29
-
30
-
31
-
32
-
33
-
34
-
35
-
36
-
37
-
38
-
39
-
40
-
41
-
42
-
43
-
44
-
 45
45 -
 46
46 -
 47
47 -
 48
48 -
 49
49 -
 50
50 -
 51
51 -
 52
52 -
 53
53 -
 54
54 -
 55
55 -
 56
56 -
 57
57 -
 58
58 -
 59
59 -
 60
60 -
 61
61 -
 62
62 -
 63
63 -
 64
64 -
 65
65 -
66
-
67
-
68
-
69
-
70
-
71
-
72
-
73
-
74
-
75
-
76
-
77
-
78
-
79
-
80
-
81
-
82
-
83
-
84
-
85
-
86
-
87
-
88
-
89
-
90
-
91
-
92
-
93
-
94
-
95
-
96
-
97
-
98
-
99
-
100
-
101
-
102
-
103
-
104
-
105
-
106
-
107
-
108
-
109
-
110
-
111
-
112
-
113
-
114
-
115
-
116
-
117
-
118
-
119
-
120
-
121
-
122
-
123
-
124
-
125
-
126
-
127
-
128
-
129
-
130
-
131
-
132
-
133
-
134
-
135
-
136
-
137
-
138
-
139
-
140
-
141
-
142
-
143
-
144
-
145
-
146
-
147
-
148
-
149
-
150
-
151
-
152
-
153
-
154
-
155
-
156
-
157
-
158
-
159
-
160
-
161
-
162
-
163
-
164
-
165
-
166
-
167
-
168
-
169
-
170
-
171
-
172
-
173
-
174
-
175
-
176
-
177
-
178
-
179
-
180
-
181
-
182
-
183
-
184
-
185
-
186
-
187
-
188
-
189
-
190
-
191
-
192
-
193
-
194
-
195
-
196
-
197
-
198
-
199
-
200
-
201
-
202
-
203
-
204
-
205
-
206
-
207
-
208
-
209
-
210
-
211
-
212
-
213
-
214
-
215
-
216
-
217
-
218
-
219
-
220
-
221
-
222
-
223
-
224
-
225
-
226
-
227
-
228
-
229
-
230
-
231
-
232
-
233
-
234
-
235
-
236
-
237
-
238
-
239
-
240
-
241
-
242
-
243
-
244
-
245
-
246
-
247
-
248
-
249
-
250
-
251
-
252
-
253
-
254
-
255
-
256
-
257
-
258
-
259
 |
 |

37
PART II
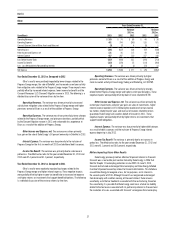
Other
Years Ended December 31,
(in millions) 2013 2012
Variance
2013 vs.
2012 2011
Variance
2012 vs.
2011
Operating Revenues $ 163 $ 74 $ 89 $ 44 $ 30
Operating Expenses 461 704 (243) 133 571
(Losses) Gains on Sales of Other Assets and Other, net (3) (7) 4 (8) 1
Operating Loss (301) (637) 336 (97) (540)
Other Income and Expense, net 131 16 115 49 (33)
Interest Expense 417 297 120 157 140
Loss Before Income Taxes (587) (918) 331 (205) (713)
Income Tax Benefit (323) (378) 55 (114) (264)
Less: Loss Attributable to Noncontrolling Interests (3) (2) (1) (15) 13
Net Expense $ (261) $ (538) $ 277 $ (76) $(462)
Year Ended December 31, 2013 as Compared to 2012
Other’s results were positively impacted by lower charges related to the
Progress Energy merger, the sale of DukeNet, and increased current year activity
from mitigation sales related to the Progress Energy merger. These impacts were
partially offset by increased interest expense, lower income tax benefit and the
Crescent Resources LLC (Crescent) litigation reserve in 2013. The following is a
detailed discussion of the variance drivers by line item.
Operating Revenues. The variance was driven primarily by increased
activity from mitigation sales related to the Progress Energy merger and higher
premiums earned at Bison as a result of the addition of Progress Energy.
Operating Expenses. The variance was driven primarily by lower charges
related to the Progress Energy merger, and prior year donations, partially offset
by the Crescent litigation reserve in 2013 and unfavorable loss experience at
Bison as a result of the addition of Progress Energy.
Other Income and Expense, net. The variance was driven primarily
by a gain on the sale of Duke Energy’s 50 percent ownership in DukeNet in 2013.
Interest Expense. The variance was due primarily to the inclusion of
Progress Energy for the first six months of 2013 and additional debt issuances.
Income Tax Benefit. The variance was primarily due to a decrease in
pretax loss. The effective tax rates for the years ended December 31, 2013 and
2012 were 55.1 percent and 41.1 percent, respectively.
Year Ended December 31, 2012 as Compared to 2011
Other’s results were negatively impacted by charges related to the
Progress Energy merger and higher interest expense. These negative impacts
were partially offset by higher income tax benefit due to increased net expense
and higher returns on investments that support benefit obligations. The following
is a detailed discussion of the variance drivers by line item.
Operating Revenues. The variance was driven primarily by higher
premiums earned at Bison as a result of the addition of Progress Energy and
mark-to-market activity at Duke Energy Trading and Marketing, LLC (DETM).
Operating Expenses. The variance was driven primarily by charges
related to the Progress Energy merger and higher current year donations. These
negative impacts were partially offset by lower JV costs related to DETM.
Other Income and Expense, net. The variance was driven primarily by
current year impairments and prior year gains on sales of investments, higher
interest income recorded in 2011 following the resolution of certain income
tax matters related to prior years and reversal of reserves related to certain
guarantees Duke Energy had issued on behalf of Crescent in 2011. These
negative impacts were partially offset by higher returns on investments that
support benefit obligations.
Interest Expense. The variance was due primarily to higher debt balances
as a result of debt issuances and the inclusion of Progress Energy interest
expense beginning in July 2012.
Income Tax Benefit. The variance is primarily due to an increase in
pretax loss. The effective tax rates for the years ended December 31, 2012 and
2011 were 41.1 percent and 56.0 percent, respectively.
Matters Impacting Future Other Results
Duke Energy previously held an effective 50 percent interest in Crescent.
Crescent was a real estate joint venture formed by Duke Energy in 2006 that
filed for Chapter 11 bankruptcy protection in June 2009. On June 9, 2010,
Crescent restructured and emerged from bankruptcy and Duke Energy forfeited
its entire 50 percent ownership interest to Crescent debt holders. This forfeiture
caused Duke Energy to recognize a loss, for tax purposes, on its interest in
the second quarter of 2010. Although Crescent has reorganized and emerged
from bankruptcy with creditors owning all Crescent interest, there remains
uncertainty as to the tax treatment associated with the restructuring. Based on
this uncertainty, it is possible that Duke Energy could incur a future tax liability
related to the tax losses associated with its partnership interest in Crescent and
the resolution of issues associated with Crescent’s emergence from bankruptcy.