Duke Energy 2013 Annual Report Download - page 182
Download and view the complete annual report
Please find page 182 of the 2013 Duke Energy annual report below. You can navigate through the pages in the report by either clicking on the pages listed below, or by using the keyword search tool below to find specific information within the annual report.-
 1
1 -
2
-
3
-
4
-
5
-
6
-
7
-
8
-
9
-
10
-
11
-
12
-
13
-
14
-
15
-
16
-
17
-
18
-
19
-
20
-
21
-
22
-
23
-
24
-
25
-
26
-
27
-
28
-
29
-
30
-
31
-
32
-
33
-
34
-
35
-
36
-
37
-
38
-
39
-
40
-
41
-
42
-
43
-
44
-
45
-
46
-
47
-
48
-
49
-
50
-
51
-
52
-
53
-
54
-
55
-
56
-
57
-
58
-
59
-
60
-
61
-
62
-
63
-
64
-
65
-
66
-
67
-
68
-
69
-
70
-
71
-
72
-
73
-
74
-
75
-
76
-
77
-
78
-
79
-
80
-
81
-
82
-
83
-
84
-
85
-
86
-
87
-
88
-
89
-
90
-
91
-
92
-
93
-
94
-
95
-
96
-
97
-
98
-
99
-
100
-
101
-
102
-
103
-
104
-
105
-
106
-
107
-
108
-
109
-
110
-
111
-
112
-
113
-
114
-
115
-
116
-
117
-
118
-
119
-
120
-
121
-
122
-
123
-
124
-
125
-
126
-
127
-
128
-
129
-
130
-
131
-
132
-
133
-
134
-
135
-
136
-
137
-
138
-
139
-
140
-
141
-
142
-
143
-
144
-
145
-
146
-
147
-
148
-
149
-
150
-
151
-
152
-
153
-
154
-
155
-
156
-
157
-
158
-
159
-
160
-
161
-
162
-
163
-
164
-
165
-
166
-
167
-
168
-
169
-
170
-
171
-
 172
172 -
 173
173 -
 174
174 -
 175
175 -
 176
176 -
 177
177 -
 178
178 -
 179
179 -
 180
180 -
 181
181 -
 182
182 -
 183
183 -
 184
184 -
 185
185 -
 186
186 -
 187
187 -
 188
188 -
 189
189 -
 190
190 -
 191
191 -
 192
192 -
193
-
194
-
195
-
196
-
197
-
198
-
199
-
200
-
201
-
202
-
203
-
204
-
205
-
206
-
207
-
208
-
209
-
210
-
211
-
212
-
213
-
214
-
215
-
216
-
217
-
218
-
219
-
220
-
221
-
222
-
223
-
224
-
225
-
226
-
227
-
228
-
229
-
230
-
231
-
232
-
233
-
234
-
235
-
236
-
237
-
238
-
239
-
240
-
241
-
242
-
243
-
244
-
245
-
246
-
247
-
248
-
249
-
250
-
251
-
252
-
253
-
254
-
255
-
256
-
257
-
258
-
259
 |
 |

164
PART II
DUKE ENERGY CORPORATION • DUKE ENERGY CAROLINAS, LLC • PROGRESS ENERGY, INC. •
DUKE ENERGY PROGRESS, INC. • DUKE ENERGY FLORIDA, INC. • DUKE ENERGY OHIO, INC. • DUKE ENERGY INDIANA, INC.
Combined Notes to Consolidated Financial Statements – (Continued)
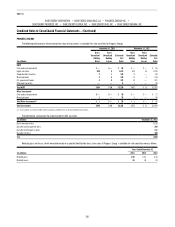
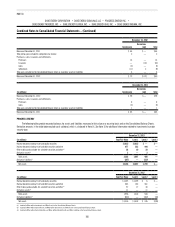
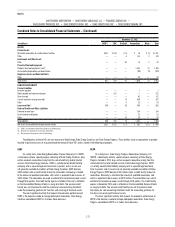
The following tables provide reconciliations of beginning and ending balances of assets and liabilities measured at fair value using Level 3 measurements.
December 31, 2013
(in millions) Investments
Derivatives
(net) Total
Balance at December 31, 2012 $ 98 $(85) $ 13
Total pretax realized or unrealized gains (losses) included in earnings(a) — (42) (42)
Purchases, sales, issuances and settlements:
Purchases 9 21 30
Sales (6) — (6)
Issuances — 11 11
Settlements (9) 25 16
Total gains included on the Consolidated Balance Sheet as regulatory assets or liabilities 6 (3) 3
Transfers out of Level 3(b) — 86 86
Balance at December 31, 2013 $ 98 $ 13 $ 111
Pretax amounts included in the Consolidated Statements of Comprehensive Income related to Level 3 measurements outstanding $ — $ 10 $ 10
(a) Amounts for derivatives are primarily included in Operating Revenues.
(b) Transfers reflect derivative contracts becoming observable due to the passage of time.
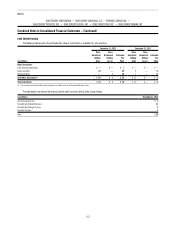
December 31, 2012
(in millions) Investments
Derivatives
(net) Total
Balance at December 31, 2011 $124 $(39) $ 85
Amounts acquired in Progress Energy Merger — (30) (30)
Total pretax realized or unrealized gains (losses) included in earnings — 8 8
Total pretax gains included in other comprehensive income 13 — 13
Purchases, sales, issuances and settlements:
Purchases 14 22 36
Sales (2) — (2)
Issuances — (15) (15)
Settlements (55) (32) (87)
Total gains included on the Consolidated Balance Sheet as regulatory assets or liabilities 4 1 5
Balance at December 31, 2012 $ 98 $(85) $ 13
December 31, 2011
(in millions) Investments
Derivatives
(net) Total
Balance at December 31, 2010 $165 $(19) $ 146
Total pretax realized or unrealized gains (losses) included in earnings — (14) (14)
Total pretax gains included in other comprehensive income 12 — 12
Net purchases, sales, issuances and settlements:
Purchases 8 8 16
Sales (3) — (3)
Settlements (16) (16) (32)
Total gains included on the Consolidated Balance Sheet as regulatory assets or liabilities (42) 2 (40)
Balance at December 31, 2011 $124 $(39) $ 85