Duke Energy 2013 Annual Report Download - page 72
Download and view the complete annual report
Please find page 72 of the 2013 Duke Energy annual report below. You can navigate through the pages in the report by either clicking on the pages listed below, or by using the keyword search tool below to find specific information within the annual report.-
 1
1 -
2
-
3
-
4
-
5
-
6
-
7
-
8
-
9
-
10
-
11
-
12
-
13
-
14
-
15
-
16
-
17
-
18
-
19
-
20
-
21
-
22
-
23
-
24
-
25
-
26
-
27
-
28
-
29
-
30
-
31
-
32
-
33
-
34
-
35
-
36
-
37
-
38
-
39
-
40
-
41
-
42
-
43
-
44
-
45
-
46
-
47
-
48
-
49
-
50
-
51
-
52
-
53
-
54
-
55
-
56
-
57
-
58
-
59
-
60
-
61
-
 62
62 -
 63
63 -
 64
64 -
 65
65 -
 66
66 -
 67
67 -
 68
68 -
 69
69 -
 70
70 -
 71
71 -
 72
72 -
 73
73 -
 74
74 -
 75
75 -
 76
76 -
 77
77 -
 78
78 -
 79
79 -
 80
80 -
 81
81 -
 82
82 -
83
-
84
-
85
-
86
-
87
-
88
-
89
-
90
-
91
-
92
-
93
-
94
-
95
-
96
-
97
-
98
-
99
-
100
-
101
-
102
-
103
-
104
-
105
-
106
-
107
-
108
-
109
-
110
-
111
-
112
-
113
-
114
-
115
-
116
-
117
-
118
-
119
-
120
-
121
-
122
-
123
-
124
-
125
-
126
-
127
-
128
-
129
-
130
-
131
-
132
-
133
-
134
-
135
-
136
-
137
-
138
-
139
-
140
-
141
-
142
-
143
-
144
-
145
-
146
-
147
-
148
-
149
-
150
-
151
-
152
-
153
-
154
-
155
-
156
-
157
-
158
-
159
-
160
-
161
-
162
-
163
-
164
-
165
-
166
-
167
-
168
-
169
-
170
-
171
-
172
-
173
-
174
-
175
-
176
-
177
-
178
-
179
-
180
-
181
-
182
-
183
-
184
-
185
-
186
-
187
-
188
-
189
-
190
-
191
-
192
-
193
-
194
-
195
-
196
-
197
-
198
-
199
-
200
-
201
-
202
-
203
-
204
-
205
-
206
-
207
-
208
-
209
-
210
-
211
-
212
-
213
-
214
-
215
-
216
-
217
-
218
-
219
-
220
-
221
-
222
-
223
-
224
-
225
-
226
-
227
-
228
-
229
-
230
-
231
-
232
-
233
-
234
-
235
-
236
-
237
-
238
-
239
-
240
-
241
-
242
-
243
-
244
-
245
-
246
-
247
-
248
-
249
-
250
-
251
-
252
-
253
-
254
-
255
-
256
-
257
-
258
-
259
 |
 |

54
PART II
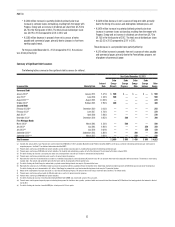
Contractual Obligations
Duke Energy enters into contracts that require payment of cash at certain specified periods, based on certain specified minimum quantities and prices. The
following table summarizes Duke Energy’s contractual cash obligations as of December 31, 2013.
Payments Due By Period
(in millions) Total
Less than
1 year (2014)
2-3 years
(2015 & 2016)
4-5 years
(2017 & 2018)
More than 5 years
(2019 & beyond)
Long-term debt(a) $ 38,740 $ 2,007 $ 5,409 $ 4,355 $26,969
Interest payments on long-term debt(b) 24,082 1,632 2,972 2,675 16,803
Capital leases(c) 2,302 171 336 342 1,453
Operating leases(c) 1,769 175 306 254 1,034
Purchase obligations:(d)
Fuel and purchased power(e) 26,893 5,163 6,787 4,099 10,844
Other purchase obligations(f) 6,193 4,400 646 305 842
Nuclear decommissioning trust annual funding(g) 912 52 105 92 663
Total contractual cash obligations(h)(i) $ 100,891 $13,600 $16,561 $12,122 $58,608
(a) See Note 6 to the Consolidated Financial Statements, “Debt and Credit Facilities.”
(b) Interest payments on variable rate debt instruments were calculated using December 31, 2013 interest rates and holding them constant for the life of the instruments.
(c) See Note 5 to the Consolidated Financial Statements, “Commitments and Contingencies.” Amounts in the table above include the interest component of capital leases based on the interest rates stated in the lease
agreements and exclude certain related executory costs.
(d) Current liabilities, except for current maturities of long-term debt, and purchase obligations reflected in the Consolidated Balance Sheets, have been excluded from the above table.
(e) Includes firm capacity payments that provide Duke Energy with uninterrupted firm access to electricity transmission capacity and natural gas transportation contracts, as well as undesignated contracts and contracts that
qualify as normal purchase/normal sale (NPNS). For contracts where the price paid is based on an index, the amount is based on market prices at December 31, 2013. For certain of these amounts, Duke Energy may settle on
a net cash basis since Duke Energy has entered into payment netting arrangements with counterparties that permit Duke Energy to offset receivables and payables with such counterparties.
(f) Includes contracts for software, telephone, data and consulting or advisory services. Amount also includes contractual obligations for engineering, procurement and construction costs for new generation plants and nuclear
plant refurbishments, environmental projects on fossil facilities, major maintenance of certain nonregulated plants, maintenance and day to day contract work at certain wind facilities and commitments to buy wind and
combustion turbines. Amount excludes certain open purchase orders for services that are provided on demand, for which the timing of the purchase cannot be determined.
(g) Related to future annual funding obligations to nuclear decommissioning trust fund (NDTF) through nuclear power stations’ re-licensing dates. Amounts through 2017 include North Carolina jurisdictional amounts that Duke
Energy Progress retained internally and is transitioning to its external decommissioning funds per a 2008 NCUC order. The transition of the original $131 million must be complete by December 31, 2017, and at least 10
percent must be transitioned each year. See Note 9 to the Consolidated Financial Statements, “Asset Retirement Obligations.”
(h) Uncertain tax positions of $230 million are not reflected in this table as Duke Energy cannot predict when open income tax years will close with completed examinations. See Note 22 to the Consolidated Financial Statements,
“Income Taxes.”
(i) The table above excludes reserves for litigation, environmental remediation, asbestos-related injuries and damages claims and self-insurance claims (see Note 5 to the Consolidated Financial Statements, “Commitments
and Contingencies”) because Duke Energy is uncertain as to the timing of when cash payments will be required. Additionally, the table above excludes annual insurance premiums that are necessary to operate the business,
including nuclear insurance (see Note 5 to the Consolidated Financial Statements, “Commitments and Contingencies”), funding of pension and other post-retirement benefit plans (see Note 21 to the Consolidated Financial
Statements, “Employee Benefit Plans”), asset retirement obligations (see Note 9 to the Consolidated Financial Statements, “Asset Retirement Obligations”) and regulatory liabilities (see Note 4 to the Consolidated Financial
Statements, “Regulatory Matters”) because the amount and timing of the cash payments are uncertain. Also excluded are Deferred Income Taxes and Investment Tax Credits recorded on the Consolidated Balance Sheets since
cash payments for income taxes are determined based primarily on taxable income for each discrete fiscal year.
QUANTITATIVE AND QUALITATIVE DISCLOSURES ABOUT MARKET RISK
Risk Management Policies
Duke Energy is exposed to market risks associated with commodity
prices, interest rates, equity prices and foreign currency exchange rates. Duke
Energy has established comprehensive risk management policies to monitor
and manage these market risks. Duke Energy’s Chief Executive Officer and
Chief Financial Officer are responsible for the overall approval of market risk
management policies and the delegation of approval and authorization levels.
The Finance and Risk Management Committee of the Board of Directors receives
periodic updates from the Chief Risk Officer and other members of management
on market risk positions, corporate exposures, and overall risk management
activities. The Chief Risk Officer is responsible for the overall governance of
managing commodity price risk, including monitoring exposure limits.
The following disclosures about market risk contain forward-looking
statements that involve estimates, projections, goals, forecasts, assumptions,
risks and uncertainties that could cause actual results or outcomes to differ
materially from those expressed in the forward-looking statements. Please
review Item 1A, “Risk Factors,” and “Cautionary Statement Regarding Forward-
Looking Information” for a discussion of the factors that may impact any such
forward-looking statements made herein.
Commodity Price Risk
Duke Energy is exposed to the impact of market fluctuations in the prices
of electricity, coal, natural gas and other energy-related products marketed and
purchased as a result of its ownership of energy related assets. Duke Energy’s
exposure to these fluctuations is limited by the cost-based regulation of its
operations in its Regulated Utilities segment as these operations are typically
allowed to recover substantially all of these costs through various cost-recovery
clauses, including fuel clauses. While there may be a delay in timing between
when these costs are incurred and when these costs are recovered through
rates, changes from year to year generally do not have a material impact on
operating results of these regulated operations.
Price risk represents the potential risk of loss from adverse changes in the
market price of electricity or other energy commodities. Duke Energy’s exposure
to commodity price risk is influenced by a number of factors, including contract
size, length, market liquidity, location and unique or specific contract terms.
Duke Energy employs established policies and procedures to manage risks
associated with these market fluctuations, which may include using various
commodity derivatives, such as swaps, futures, forwards and options. For
additional information, see Note 14 to the Consolidated Financial Statements,
“Derivatives and Hedging.”
Validation of a contract’s fair value is performed by an internal group
separate from Duke Energy’s deal origination function. While Duke Energy uses
common industry practices to develop its valuation techniques, changes in its
pricing methodologies or the underlying assumptions could result in significantly
different fair values and income recognition.
HEDGING STRATEGIES
Duke Energy closely monitors risks associated with commodity price
changes on its future operations and, where appropriate, uses various