Duke Energy 2013 Annual Report Download - page 130
Download and view the complete annual report
Please find page 130 of the 2013 Duke Energy annual report below. You can navigate through the pages in the report by either clicking on the pages listed below, or by using the keyword search tool below to find specific information within the annual report.-
 1
1 -
2
-
3
-
4
-
5
-
6
-
7
-
8
-
9
-
10
-
11
-
12
-
13
-
14
-
15
-
16
-
17
-
18
-
19
-
20
-
21
-
22
-
23
-
24
-
25
-
26
-
27
-
28
-
29
-
30
-
31
-
32
-
33
-
34
-
35
-
36
-
37
-
38
-
39
-
40
-
41
-
42
-
43
-
44
-
45
-
46
-
47
-
48
-
49
-
50
-
51
-
52
-
53
-
54
-
55
-
56
-
57
-
58
-
59
-
60
-
61
-
62
-
63
-
64
-
65
-
66
-
67
-
68
-
69
-
70
-
71
-
72
-
73
-
74
-
75
-
76
-
77
-
78
-
79
-
80
-
81
-
82
-
83
-
84
-
85
-
86
-
87
-
88
-
89
-
90
-
91
-
92
-
93
-
94
-
95
-
96
-
97
-
98
-
99
-
100
-
101
-
102
-
103
-
104
-
105
-
106
-
107
-
108
-
109
-
110
-
111
-
112
-
113
-
114
-
115
-
116
-
117
-
118
-
119
-
 120
120 -
 121
121 -
 122
122 -
 123
123 -
 124
124 -
 125
125 -
 126
126 -
 127
127 -
 128
128 -
 129
129 -
 130
130 -
 131
131 -
 132
132 -
 133
133 -
 134
134 -
 135
135 -
 136
136 -
 137
137 -
 138
138 -
 139
139 -
 140
140 -
141
-
142
-
143
-
144
-
145
-
146
-
147
-
148
-
149
-
150
-
151
-
152
-
153
-
154
-
155
-
156
-
157
-
158
-
159
-
160
-
161
-
162
-
163
-
164
-
165
-
166
-
167
-
168
-
169
-
170
-
171
-
172
-
173
-
174
-
175
-
176
-
177
-
178
-
179
-
180
-
181
-
182
-
183
-
184
-
185
-
186
-
187
-
188
-
189
-
190
-
191
-
192
-
193
-
194
-
195
-
196
-
197
-
198
-
199
-
200
-
201
-
202
-
203
-
204
-
205
-
206
-
207
-
208
-
209
-
210
-
211
-
212
-
213
-
214
-
215
-
216
-
217
-
218
-
219
-
220
-
221
-
222
-
223
-
224
-
225
-
226
-
227
-
228
-
229
-
230
-
231
-
232
-
233
-
234
-
235
-
236
-
237
-
238
-
239
-
240
-
241
-
242
-
243
-
244
-
245
-
246
-
247
-
248
-
249
-
250
-
251
-
252
-
253
-
254
-
255
-
256
-
257
-
258
-
259
 |
 |

112
PART II
DUKE ENERGY CORPORATION • DUKE ENERGY CAROLINAS, LLC • PROGRESS ENERGY, INC. •
DUKE ENERGY PROGRESS, INC. • DUKE ENERGY FLORIDA, INC. • DUKE ENERGY OHIO, INC. • DUKE ENERGY INDIANA, INC.
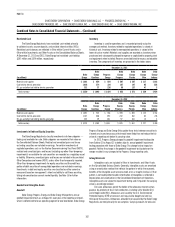
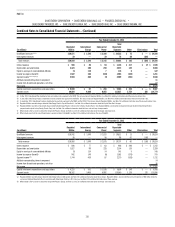
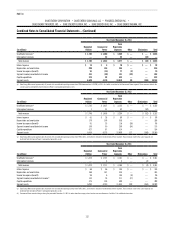
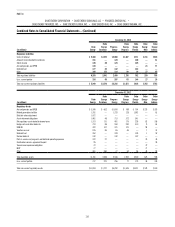
Combined Notes to Consolidated Financial Statements – (Continued)
Year Ended December 31, 2013
(in millions)
Regulated
Utilities
Commercial
Power
Total
Reportable
Segments Other Eliminations Total
Unafliated revenues(a) $ 1,765 $ 1,480 $ 3,245 $ — $ — $ 3,245
Intersegment revenues — 32 32 — (32) —
Total revenues $ 1,765 $ 1,512 $ 3,277 $ — $ (32) $ 3,245
Interest expense $ 74 $ 4 $ 78 $ — $ — $ 78
Depreciation and amortization 200 154 354 — — 354
Income tax expense (benet) 91 (14) 77 (2) — 75
Segment income/consolidated net income 151 (20) 131 (29) — 102
Capital expenditures 375 58 433 — — 433
Segment assets 6,649 4,170 10,819 99 (155) 10,763
(a) Duke Energy Ohio earned approximately 37 percent of its consolidated operating revenues from PJM Interconnection, LLC (PJM) in 2013, all of which is included in the Commercial Power segment. These revenues relate to the
sale of capacity and electricity from Commercial Power’s nonregulated generation assets.
Year Ended December 31, 2012
(in millions)
Regulated
Utilities
Commercial
Power
Total
Reportable
Segments Other Eliminations Total
Unafliated revenues(a) $ 1,745 $ 1,407 $ 3,152 $ — $ — $ 3,152
Intersegment revenues 1 51 52 — (52) —
Total revenues $ 1,746 $ 1,458 $ 3,204 $— $ (52) $ 3,152
Interest expense $ 61 $ 28 $ 89 $ — $ — $ 89
Depreciation and amortization 179 159 338 — — 338
Income tax expense (benet) 91 25 116 (18) — 98
Segment income/consolidated net income 159 50 209 (34) — 175
Capital expenditures 427 87 514 — — 514
Segment assets 6,434 4,175 10,609 117 (166) 10,560
(a) Duke Energy Ohio earned approximately 36 percent of its consolidated operating revenues from PJM in 2012, all of which is included in the Commercial Power segment. These revenues relate to the sale of capacity and
electricity from Commercial P ower’s nonregulated generation assets.
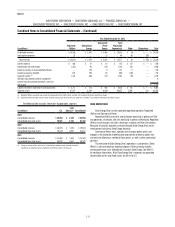
Year Ended December 31, 2011
(in millions)
Regulated
Utilities
Commercial
Power
Total
Reportable
Segments Other Eliminations Total
Unafliated revenues(a) $ 1,474 $ 1,707 $ 3,181 $ — $ — $ 3,181
Intersegment revenues — 4 4 — (4) —
Total revenues $ 1,474 $ 1,711 $ 3,185 $ — $ (4) $ 3,181
Interest expense $ 68 $ 36 $ 104 $ — $ — $ 104
Depreciation and amortization 168 167 335 — — 335
Income tax expense (benet) 98 6 104 (8) — 96
Segment income/consolidated net income(b) 133 78 211 (17) — 194
Capital expenditures 375 124 499 — — 499
Segment assets 6,293 4,740 11,033 259 (353) 10,939
(a) Duke Energy Ohio earned approximately 24 percent of its consolidated operating revenues from PJM in 2011, all of which is included in the Commercial Power segment. These revenues relate to the sale of capacity and
electricity from Commercial Power’s nonregulated generation assets.
(b) Commercial Power recorded charges during the year ended December 31, 2011, to write-down the carrying value of certain emission allowances. See Note 11 for additional information.