Duke Energy 2013 Annual Report Download - page 83
Download and view the complete annual report
Please find page 83 of the 2013 Duke Energy annual report below. You can navigate through the pages in the report by either clicking on the pages listed below, or by using the keyword search tool below to find specific information within the annual report.-
 1
1 -
2
-
3
-
4
-
5
-
6
-
7
-
8
-
9
-
10
-
11
-
12
-
13
-
14
-
15
-
16
-
17
-
18
-
19
-
20
-
21
-
22
-
23
-
24
-
25
-
26
-
27
-
28
-
29
-
30
-
31
-
32
-
33
-
34
-
35
-
36
-
37
-
38
-
39
-
40
-
41
-
42
-
43
-
44
-
45
-
46
-
47
-
48
-
49
-
50
-
51
-
52
-
53
-
54
-
55
-
56
-
57
-
58
-
59
-
60
-
61
-
62
-
63
-
64
-
65
-
66
-
67
-
68
-
69
-
70
-
71
-
72
-
 73
73 -
 74
74 -
 75
75 -
 76
76 -
 77
77 -
 78
78 -
 79
79 -
 80
80 -
 81
81 -
 82
82 -
 83
83 -
 84
84 -
 85
85 -
 86
86 -
 87
87 -
 88
88 -
 89
89 -
 90
90 -
 91
91 -
 92
92 -
 93
93 -
94
-
95
-
96
-
97
-
98
-
99
-
100
-
101
-
102
-
103
-
104
-
105
-
106
-
107
-
108
-
109
-
110
-
111
-
112
-
113
-
114
-
115
-
116
-
117
-
118
-
119
-
120
-
121
-
122
-
123
-
124
-
125
-
126
-
127
-
128
-
129
-
130
-
131
-
132
-
133
-
134
-
135
-
136
-
137
-
138
-
139
-
140
-
141
-
142
-
143
-
144
-
145
-
146
-
147
-
148
-
149
-
150
-
151
-
152
-
153
-
154
-
155
-
156
-
157
-
158
-
159
-
160
-
161
-
162
-
163
-
164
-
165
-
166
-
167
-
168
-
169
-
170
-
171
-
172
-
173
-
174
-
175
-
176
-
177
-
178
-
179
-
180
-
181
-
182
-
183
-
184
-
185
-
186
-
187
-
188
-
189
-
190
-
191
-
192
-
193
-
194
-
195
-
196
-
197
-
198
-
199
-
200
-
201
-
202
-
203
-
204
-
205
-
206
-
207
-
208
-
209
-
210
-
211
-
212
-
213
-
214
-
215
-
216
-
217
-
218
-
219
-
220
-
221
-
222
-
223
-
224
-
225
-
226
-
227
-
228
-
229
-
230
-
231
-
232
-
233
-
234
-
235
-
236
-
237
-
238
-
239
-
240
-
241
-
242
-
243
-
244
-
245
-
246
-
247
-
248
-
249
-
250
-
251
-
252
-
253
-
254
-
255
-
256
-
257
-
258
-
259
 |
 |

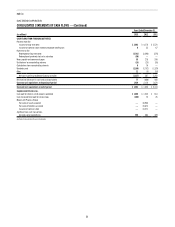
65
PART II
Years Ended December 31,
(in millions) 2013 2012 2011
CASH FLOWS FROM OPERATING ACTIVITIES
Net income $ 2,676 $ 1,782 $ 1,714
Adjustments to reconcile net income to net cash provided by operating activities:
Depreciation, amortization and accretion (including amortization of nuclear fuel) 3,229 2,652 2,026
Equity component of AFUDC (157) (300) (260)
Severance expense —92 —
FERC mitigation costs —117 —
Community support and charitable contributions expense 34 92 —
Gains on sales of other assets (79) (44) (19)
Impairment of other long-lived assets 400 586 335
Deferred income taxes 1,264 584 602
Equity in earnings of unconsolidated affiliates (122) (148) (160)
Voluntary opportunity cost deferral —(101) —
Accrued pension and other post-retirement benefit costs 307 239 104
Contributions to qualified pension plans (250) (304) (200)
(Increase) decrease in
Net realized and unrealized mark-to-market and hedging transactions 160 (48)
Receivables (281) 39 2
Inventory (31) (258) (247)
Other current assets (35) 140 185
Increase (decrease) in
Accounts payable 73 131 41
Taxes accrued 77 (142) 27
Other current liabilities 24 295 (254)
Other assets (384) (129) 12
Other liabilities (364) (139) (188)
Net cash provided by operating activities 6,382 5,244 3,672
CASH FLOWS FROM INVESTING ACTIVITIES
Capital expenditures (5,526) (5,501) (4,363)
Investment expenditures (81) (6) (50)
Acquisitions —(451) (51)
Cash acquired from the merger with Progress Energy —71 —
Purchases of available-for-sale securities (6,142) (4,719) (3,194)
Proceeds from sales and maturities of available-for-sale securities 6,315 4,537 3,063
Net proceeds from the sales of equity investments and other assets, and sales of and collections on notes receivable 277 212 118
Change in restricted cash 167 (414) 22
Other 12 74 21
Net cash used in investing activities (4,978) (6,197) (4,434)
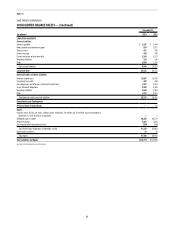
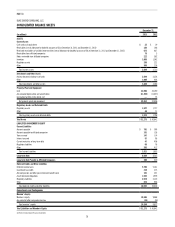
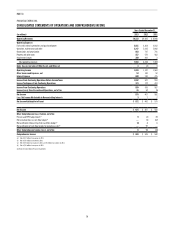
DUKE ENERGY CORPORATION
CONSOLIDATED STATEMENTS OF CASH FLOWS
See Notes to Consolidated Financial Statements