Duke Energy 2013 Annual Report Download - page 219
Download and view the complete annual report
Please find page 219 of the 2013 Duke Energy annual report below. You can navigate through the pages in the report by either clicking on the pages listed below, or by using the keyword search tool below to find specific information within the annual report.-
 1
1 -
2
-
3
-
4
-
5
-
6
-
7
-
8
-
9
-
10
-
11
-
12
-
13
-
14
-
15
-
16
-
17
-
18
-
19
-
20
-
21
-
22
-
23
-
24
-
25
-
26
-
27
-
28
-
29
-
30
-
31
-
32
-
33
-
34
-
35
-
36
-
37
-
38
-
39
-
40
-
41
-
42
-
43
-
44
-
45
-
46
-
47
-
48
-
49
-
50
-
51
-
52
-
53
-
54
-
55
-
56
-
57
-
58
-
59
-
60
-
61
-
62
-
63
-
64
-
65
-
66
-
67
-
68
-
69
-
70
-
71
-
72
-
73
-
74
-
75
-
76
-
77
-
78
-
79
-
80
-
81
-
82
-
83
-
84
-
85
-
86
-
87
-
88
-
89
-
90
-
91
-
92
-
93
-
94
-
95
-
96
-
97
-
98
-
99
-
100
-
101
-
102
-
103
-
104
-
105
-
106
-
107
-
108
-
109
-
110
-
111
-
112
-
113
-
114
-
115
-
116
-
117
-
118
-
119
-
120
-
121
-
122
-
123
-
124
-
125
-
126
-
127
-
128
-
129
-
130
-
131
-
132
-
133
-
134
-
135
-
136
-
137
-
138
-
139
-
140
-
141
-
142
-
143
-
144
-
145
-
146
-
147
-
148
-
149
-
150
-
151
-
152
-
153
-
154
-
155
-
156
-
157
-
158
-
159
-
160
-
161
-
162
-
163
-
164
-
165
-
166
-
167
-
168
-
169
-
170
-
171
-
172
-
173
-
174
-
175
-
176
-
177
-
178
-
179
-
180
-
181
-
182
-
183
-
184
-
185
-
186
-
187
-
188
-
189
-
190
-
191
-
192
-
193
-
194
-
195
-
196
-
197
-
198
-
199
-
200
-
201
-
202
-
203
-
204
-
205
-
206
-
207
-
208
-
 209
209 -
 210
210 -
 211
211 -
 212
212 -
 213
213 -
 214
214 -
 215
215 -
 216
216 -
 217
217 -
 218
218 -
 219
219 -
 220
220 -
 221
221 -
 222
222 -
 223
223 -
 224
224 -
 225
225 -
 226
226 -
 227
227 -
 228
228 -
 229
229 -
230
-
231
-
232
-
233
-
234
-
235
-
236
-
237
-
238
-
239
-
240
-
241
-
242
-
243
-
244
-
245
-
246
-
247
-
248
-
249
-
250
-
251
-
252
-
253
-
254
-
255
-
256
-
257
-
258
-
259
 |
 |

201
PART II
DUKE ENERGY CORPORATION • DUKE ENERGY CAROLINAS, LLC • PROGRESS ENERGY, INC. •
DUKE ENERGY PROGRESS, INC. • DUKE ENERGY FLORIDA, INC. • DUKE ENERGY OHIO, INC. • DUKE ENERGY INDIANA, INC.
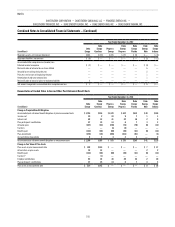
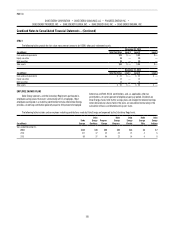
Combined Notes to Consolidated Financial Statements – (Continued)
Year Ended December 31, 2012
(in millions)
Duke
Energy
Duke
Energy
Carolinas
Progress
Energy
Duke
Energy
Progress
Duke
Energy
Florida
Duke
Energy
Ohio
Duke
Energy
Indiana
Income tax expense, computed at the statutory rate of 35 percent $ 858 $ 461 $ 185 $ 134 $ 145 $ 96 $ (43)
State income tax, net of federal income tax effect 64 34 33 1 14 1 1
Tax differential on foreign earnings (66) — — — — — —
AFUDC equity income (101) (54) (37) (24) (13) (2) (26)
Renewable energy production tax credits (25) — — — — — —
Other items, net (25) 12 (9) (1) 1 3 (5)
Income tax expense (benefit) from continuing operations $ 705 $ 453 $ 172 $ 110 $ 147 $ 98 $ (73)
Effective tax rate 28.8 % 34.3 % 32.7 % 28.7 % 35.7 % 36.0 % 59.5 %
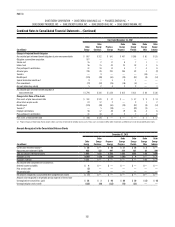
Year Ended December 31, 2011
(in millions)
Duke
Energy
Duke
Energy
Carolinas
Progress
Energy
Duke
Energy
Progress
Duke
Energy
Florida
Duke
Energy
Ohio
Duke
Energy
Indiana
Income tax expense, computed at the statutory rate of 35 percent $ 863 $ 457 $ 319 $ 270 $ 173 $ 102 $ 85
State income tax, net of federal income tax effect 50 46 39 18 17 (1) 13
Tax differential on foreign earnings (44) — — — — — —
AFUDC equity income (91) (59) (36) (25) (11) (2) (31)
Renewable energy production tax credits (21) — — — — — —
Other items, net (5) 28 1 (7) 1 (3) 7
Income tax expense from continuing operations $ 752 $ 472 $ 323 $ 256 $ 180 $ 96 $ 74
Effective tax rate 30.5 % 36.1 % 35.6 % 33.2 % 36.3 % 33.1 % 30.6 %
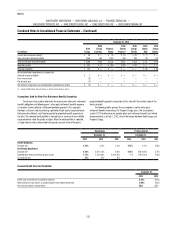
Valuation allowances have been established for certain foreign and state
NOL carryforwards and state income tax credits that reduce deferred tax assets
to an amount that will be realized on a more-likely-than-not basis. The net
change in the total valuation allowance is included in Tax differential on foreign
earnings and State income tax, net of federal income tax effect in the above
tables.
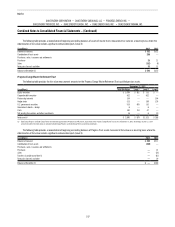
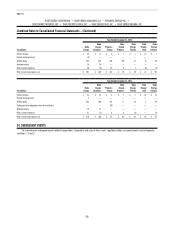
DEFERRED TAXES
Net Deferred Income Tax Liability Components
December 31, 2013
(in millions)
Duke
Energy
Duke
Energy
Carolinas
Progress
Energy
Duke
Energy
Progress
Duke
Energy
Florida
Duke
Energy
Ohio
Duke
Energy
Indiana
Deferred credits and other liabilities $ 245 $ 56 $ 136 $ 9 $ 96 $ (13) $ 9
Capital lease obligations 59 11 — — — — (2)
Pension, postretirement and other employee benefits 649 18 341 119 145 23 54
Progress Energy merger purchase accounting adjustments(a) 1,184 — — — — — —
Tax credits and NOL carryforwards 4,307 488 1,965 396 365 165 521
Other 265 15 116 39 43 20 14
Valuation allowance (192) — (40) (1) — — —
Total deferred income tax assets 6,517 588 2,518 562 649 195 596
Investments and other assets (1,396) (999) (209) (160) (49) (17) (7)
Accelerated depreciation rates (12,615) (4,400) (3,663) (2,528) (1,160) (1,937) (1,591)
Regulatory assets and deferred debits (3,185) (609) (1,389) (202) (1,159) (168) (117)
Total deferred income tax liabilities (17,196) (6,008) (5,261) (2,890) (2,368) (2,122) (1,715)
Net deferred income tax liabilities $ (10,679) $ (5,420) $ (2,743) $(2,328) $ (1,719) $(1,927) $ (1,119)
(a) Primarily related to capital lease obligations and debt fair value adjustments.