Duke Energy 2013 Annual Report Download - page 23
Download and view the complete annual report
Please find page 23 of the 2013 Duke Energy annual report below. You can navigate through the pages in the report by either clicking on the pages listed below, or by using the keyword search tool below to find specific information within the annual report.-
 1
1 -
2
-
3
-
4
-
5
-
6
-
7
-
8
-
9
-
10
-
11
-
12
-
 13
13 -
 14
14 -
 15
15 -
 16
16 -
 17
17 -
 18
18 -
 19
19 -
 20
20 -
 21
21 -
 22
22 -
 23
23 -
 24
24 -
 25
25 -
 26
26 -
 27
27 -
 28
28 -
 29
29 -
 30
30 -
 31
31 -
 32
32 -
 33
33 -
34
-
35
-
36
-
37
-
38
-
39
-
40
-
41
-
42
-
43
-
44
-
45
-
46
-
47
-
48
-
49
-
50
-
51
-
52
-
53
-
54
-
55
-
56
-
57
-
58
-
59
-
60
-
61
-
62
-
63
-
64
-
65
-
66
-
67
-
68
-
69
-
70
-
71
-
72
-
73
-
74
-
75
-
76
-
77
-
78
-
79
-
80
-
81
-
82
-
83
-
84
-
85
-
86
-
87
-
88
-
89
-
90
-
91
-
92
-
93
-
94
-
95
-
96
-
97
-
98
-
99
-
100
-
101
-
102
-
103
-
104
-
105
-
106
-
107
-
108
-
109
-
110
-
111
-
112
-
113
-
114
-
115
-
116
-
117
-
118
-
119
-
120
-
121
-
122
-
123
-
124
-
125
-
126
-
127
-
128
-
129
-
130
-
131
-
132
-
133
-
134
-
135
-
136
-
137
-
138
-
139
-
140
-
141
-
142
-
143
-
144
-
145
-
146
-
147
-
148
-
149
-
150
-
151
-
152
-
153
-
154
-
155
-
156
-
157
-
158
-
159
-
160
-
161
-
162
-
163
-
164
-
165
-
166
-
167
-
168
-
169
-
170
-
171
-
172
-
173
-
174
-
175
-
176
-
177
-
178
-
179
-
180
-
181
-
182
-
183
-
184
-
185
-
186
-
187
-
188
-
189
-
190
-
191
-
192
-
193
-
194
-
195
-
196
-
197
-
198
-
199
-
200
-
201
-
202
-
203
-
204
-
205
-
206
-
207
-
208
-
209
-
210
-
211
-
212
-
213
-
214
-
215
-
216
-
217
-
218
-
219
-
220
-
221
-
222
-
223
-
224
-
225
-
226
-
227
-
228
-
229
-
230
-
231
-
232
-
233
-
234
-
235
-
236
-
237
-
238
-
239
-
240
-
241
-
242
-
243
-
244
-
245
-
246
-
247
-
248
-
249
-
250
-
251
-
252
-
253
-
254
-
255
-
256
-
257
-
258
-
259
 |
 |

PART I
5
ITEM 1. BUSINESS
DUKE ENERGY
General
Duke Energy Corporation (collectively with its subsidiaries, Duke Energy)
is an energy company headquartered in Charlotte, North Carolina, subject to
regulation by the Federal Energy Regulatory Commission (FERC). Duke Energy
operates in the U.S. primarily through its direct and indirect wholly owned
subsidiaries, Duke Energy Carolinas, LLC (Duke Energy Carolinas), Duke Energy
Progress, Inc. (Duke Energy Progress) (formerly Carolina Power & Light Company
d/b/a Progress Energy Carolinas), Duke Energy Florida, Inc. (Duke Energy
Florida) (formerly Florida Power Corporation d/b/a Progress Energy Florida),
Duke Energy Ohio, Inc. (Duke Energy Ohio), and Duke Energy Indiana, Inc. (Duke
Energy Indiana), as well as in Latin America. When discussing Duke Energy’s
consolidated financial information, it necessarily includes the results of its six
separate subsidiary registrants, Duke Energy Carolinas, Duke Energy Progress,
Progress Energy, Inc. (Progress Energy), Duke Energy Florida, Duke Energy Ohio,
and Duke Energy Indiana, which are collectively referred to as the Subsidiary
Registrants. All of these entities, along with Duke Energy, are collectively
referred to as the Duke Energy Registrants.
The Duke Energy Registrants electronically file reports with the Securities
and Exchange Commission (SEC), including annual reports on Form 10-K,
quarterly reports on Form 10-Q, current reports on Form 8-K, proxies and
amendments to such reports.
The public may read and copy any materials the Duke Energy Registrants
file with the SEC at the SEC’s Public Reference Room at 100 F Street, N.E.,
Washington, D.C. 20549. The public may obtain information on the operation
of the Public Reference Room by calling the SEC at 1-800-SEC-0330. The SEC
also maintains an Internet site that contains reports, proxy and information
statements, and other information regarding issuers that file electronically with
the SEC at http://www.sec.gov. Additionally, information about the Duke Energy
Registrants, including reports filed with the SEC, is available through Duke
Energy’s website at http://www.duke-energy.com. Such reports are accessible
at no charge and are made available as soon as reasonably practicable after
such material is filed with or furnished to the SEC.
Business Segments
Duke Energy conducts its operations in three business segments;
Regulated Utilities, International Energy and Commercial Power. The remainder
of Duke Energy’s operations are presented as Other. Duke Energy’s chief
operating decision maker regularly reviews financial information about each of
these business segments in deciding how to allocate resources and evaluate
performance. For additional information on each of these business segments,
including financial and geographic information, see Note 3 to the Consolidated
Financial Statements, “Business Segments.”
The following sections describe the business and operations of each of
Duke Energy’s reportable business segments, as well as Other.
REGULATED UTILITIES
Regulated Utilities conducts operations primarily through Duke Energy
Carolinas, Duke Energy Progress, Duke Energy Florida, Duke Energy Indiana,
and the regulated transmission and distribution operations of Duke Energy Ohio.
These electric and gas operations are subject to the rules and regulations of
the FERC, the North Carolina Utilities Commission (NCUC), the Public Service
Commission of South Carolina (PSCSC), the Florida Public Service Commission
(FPSC), the Public Utilities Commission of Ohio (PUCO), the Indiana Utility
Regulatory Commission (IURC), and the Kentucky Public Service Commission
(KPSC).
Regulated Utilities serves 7.2 million retail electric customers in six states
in the Southeast and Midwest regions of the United States. Its service area
covers approximately 104,000 square miles with an estimated population of
21 million people. Regulated Utilities serves 500,000 retail natural gas
customers in southwestern Ohio and northern Kentucky. Electricity is also sold
wholesale to incorporated municipalities, electric cooperative utilities and other
load-serving entities.
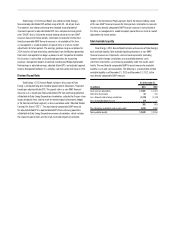
The following table represents the distribution of billed sales by customer class for the year ended December 31, 2013.
Duke
Energy
Carolinas(a)
Duke
Energy
Progress(a)
Duke
Energy
Florida(b)
Duke
Energy
Ohio(c)
Duke
Energy
Indiana(d)
Residential 32% 29% 49% 36% 27%
General service 32% 25% 39% 38% 25%
Industrial 25% 18% 8% 24% 31%
Total retail sales 89% 72% 96% 98% 83%
Wholesale sales 11% 28% 4% 2% 17%
Total sales 100% 100% 100% 100% 100%
(a) Primary general service sectors include healthcare, education, financial services, information technology and military buildings. Primary industrial sectors include textiles, chemicals, rubber and plastics, paper, food and
beverage, and auto manufacturing.
(b) Primary general service sectors include tourism, healthcare and agriculture. Primary industrial sectors include phosphate rock mining and processing, electronics design and manufacturing, and citrus and other food
processing.
(c) Primary general service sectors include healthcare, education, real estate and rental leasing, financial and insurance services, and wholesale trade services. Primary industrial sectors include aerospace, primary metals,
chemicals and food.
(d) Primary general service sectors include retail, financial, healthcare and education services. Primary industrial sectors include primary and fabricated metals, transportation equipment, building materials, food and beverage,
and chemicals.
The number of residential, general service and industrial customers
within the Regulated Utilities service territory is expected to increase over time.
However, growth in the near-term is being hampered by the current economic
conditions. Average usage per residential customer is expected to remain flat
for the foreseeable future. While total industrial sales increased in 2013 when
compared to 2012, the growth rate was modest when compared to historical
periods.
Seasonality and the Impact of Weather
Regulated Utilities’ costs and revenues are influenced by seasonal
patterns. Peak sales of electricity occur during the summer and winter months,
resulting in higher revenue and cash flows in these periods. By contrast, lower
sales of electricity occur during the spring and fall, allowing for scheduled plant
maintenance. Peak gas sales occur during the winter months. Residential and