SunTrust 2014 Annual Report Download - page 97
Download and view the complete annual report
Please find page 97 of the 2014 SunTrust annual report below. You can navigate through the pages in the report by either clicking on the pages listed below, or by using the keyword search tool below to find specific information within the annual report.-
 1
1 -
2
-
3
-
4
-
5
-
6
-
7
-
8
-
9
-
10
-
11
-
12
-
13
-
14
-
15
-
16
-
17
-
18
-
19
-
20
-
21
-
22
-
23
-
24
-
25
-
26
-
27
-
28
-
29
-
30
-
31
-
32
-
33
-
34
-
35
-
36
-
37
-
38
-
39
-
40
-
41
-
42
-
43
-
44
-
45
-
46
-
47
-
48
-
49
-
50
-
51
-
52
-
53
-
54
-
55
-
56
-
57
-
58
-
59
-
60
-
61
-
62
-
63
-
64
-
65
-
66
-
67
-
68
-
69
-
70
-
71
-
72
-
73
-
74
-
75
-
76
-
77
-
78
-
79
-
80
-
81
-
82
-
83
-
84
-
85
-
86
-
 87
87 -
 88
88 -
 89
89 -
 90
90 -
 91
91 -
 92
92 -
 93
93 -
 94
94 -
 95
95 -
 96
96 -
 97
97 -
 98
98 -
 99
99 -
 100
100 -
 101
101 -
 102
102 -
 103
103 -
 104
104 -
 105
105 -
 106
106 -
 107
107 -
108
-
109
-
110
-
111
-
112
-
113
-
114
-
115
-
116
-
117
-
118
-
119
-
120
-
121
-
122
-
123
-
124
-
125
-
126
-
127
-
128
-
129
-
130
-
131
-
132
-
133
-
134
-
135
-
136
-
137
-
138
-
139
-
140
-
141
-
142
-
143
-
144
-
145
-
146
-
147
-
148
-
149
-
150
-
151
-
152
-
153
-
154
-
155
-
156
-
157
-
158
-
159
-
160
-
161
-
162
-
163
-
164
-
165
-
166
-
167
-
168
-
169
-
170
-
171
-
172
-
173
-
174
-
175
-
176
-
177
-
178
-
179
-
180
-
181
-
182
-
183
-
184
-
185
-
186
-
187
-
188
-
189
-
190
-
191
-
192
-
193
-
194
-
195
-
196
-
197
-
198
-
199
 |
 |
74
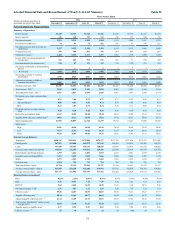
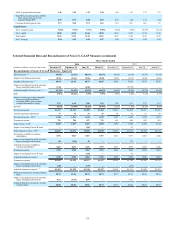
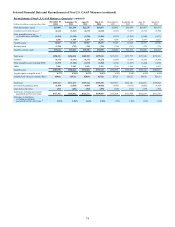
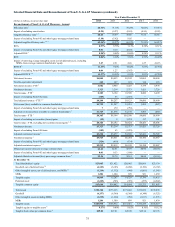
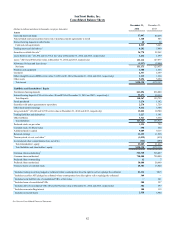
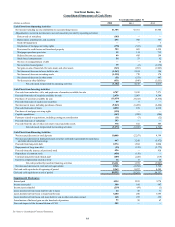
Selected Financial Data and Reconcilement of Non-U.S. GAAP Measures (continued)
Reconcilement of Non-U.S. GAAP Measures - Quarterly (continued)
(Dollars in millions, except per share data) December 31,
2014 September 30,
2014 June 30,
2014 March 31,
2014 December 31,
2013 September 30,
2013 June 30,
2013 March 31,
2013
Total shareholders’ equity $23,005 $22,269 $22,131 $21,817 $21,422 $21,070 $21,007 $21,194
Goodwill, net of deferred taxes 10 (6,123) (6,127) (6,131) (6,184) (6,183)(6,189)(6,195) (6,200)
Other intangible assets, net
of deferred taxes, and MSRs 11 (1,219) (1,320) (1,276) (1,281) (1,332)(1,285)(1,240) (1,071)
MSRs 1,206 1,305 1,259 1,251 1,300 1,248 1,199 1,025
Tangible equity 16,869 16,127 15,983 15,603 15,207 14,844 14,771 14,948
Preferred stock (1,225) (725) (725) (725) (725)(725)(725) (725)
Tangible common equity $15,644 $15,402 $15,258 $14,878 $14,482 $14,119 $14,046 $14,223
Total assets $190,328 $186,818 $182,559 $179,542 $175,335 $171,777 $171,546 $172,435
Goodwill (6,337) (6,337) (6,337) (6,377) (6,369)(6,369)(6,369) (6,369)
Other intangible assets including MSRs (1,219) (1,320) (1,277) (1,282) (1,334)(1,287)(1,244) (1,076)
MSRs 1,206 1,305 1,259 1,251 1,300 1,248 1,199 1,025
Tangible assets $183,978 $180,466 $176,204 $173,134 $168,932 $165,369 $165,132 $166,015
Tangible equity to tangible assets 89.17% 8.94% 9.07% 9.01% 9.00% 8.98% 8.95% 9.00%
Tangible book value per common share 4$29.82 $29.21 $28.64 $27.82 $27.01 $26.27 $26.08 $26.33
Total loans $133,112 $132,151 $129,744 $129,196 $127,877 $124,340 $122,031 $120,804
Government-guaranteed loans (5,459) (5,965) (6,081) (8,828) (8,961)(9,016)(9,053) (9,205)
Loans held at fair value (272) (284) (292) (299) (302)(316)(339) (360)
Total loans, excluding government-
guaranteed and fair value loans $127,381 $125,902 $123,371 $120,069 $118,614 $115,008 $112,639 $111,239
Allowance to total loans,
excluding government-
guaranteed and fair value loans 12 1.52% 1.56% 1.62% 1.70% 1.72% 1.80% 1.89% 1.93%