SunTrust 2014 Annual Report Download - page 117
Download and view the complete annual report
Please find page 117 of the 2014 SunTrust annual report below. You can navigate through the pages in the report by either clicking on the pages listed below, or by using the keyword search tool below to find specific information within the annual report.-
 1
1 -
2
-
3
-
4
-
5
-
6
-
7
-
8
-
9
-
10
-
11
-
12
-
13
-
14
-
15
-
16
-
17
-
18
-
19
-
20
-
21
-
22
-
23
-
24
-
25
-
26
-
27
-
28
-
29
-
30
-
31
-
32
-
33
-
34
-
35
-
36
-
37
-
38
-
39
-
40
-
41
-
42
-
43
-
44
-
45
-
46
-
47
-
48
-
49
-
50
-
51
-
52
-
53
-
54
-
55
-
56
-
57
-
58
-
59
-
60
-
61
-
62
-
63
-
64
-
65
-
66
-
67
-
68
-
69
-
70
-
71
-
72
-
73
-
74
-
75
-
76
-
77
-
78
-
79
-
80
-
81
-
82
-
83
-
84
-
85
-
86
-
87
-
88
-
89
-
90
-
91
-
92
-
93
-
94
-
95
-
96
-
97
-
98
-
99
-
100
-
101
-
102
-
103
-
104
-
105
-
106
-
 107
107 -
 108
108 -
 109
109 -
 110
110 -
 111
111 -
 112
112 -
 113
113 -
 114
114 -
 115
115 -
 116
116 -
 117
117 -
 118
118 -
 119
119 -
 120
120 -
 121
121 -
 122
122 -
 123
123 -
 124
124 -
 125
125 -
 126
126 -
 127
127 -
128
-
129
-
130
-
131
-
132
-
133
-
134
-
135
-
136
-
137
-
138
-
139
-
140
-
141
-
142
-
143
-
144
-
145
-
146
-
147
-
148
-
149
-
150
-
151
-
152
-
153
-
154
-
155
-
156
-
157
-
158
-
159
-
160
-
161
-
162
-
163
-
164
-
165
-
166
-
167
-
168
-
169
-
170
-
171
-
172
-
173
-
174
-
175
-
176
-
177
-
178
-
179
-
180
-
181
-
182
-
183
-
184
-
185
-
186
-
187
-
188
-
189
-
190
-
191
-
192
-
193
-
194
-
195
-
196
-
197
-
198
-
199
 |
 |

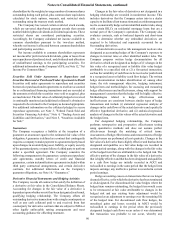
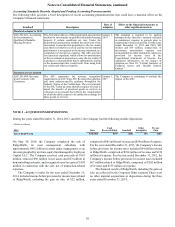
Notes to Consolidated Financial Statements, continued
94
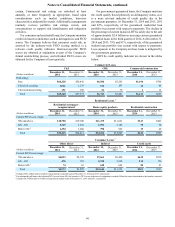
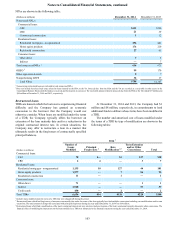
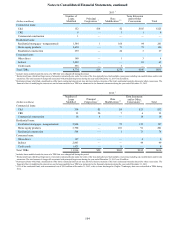
The following table presents the Company's eligible securities borrowed or purchased under agreements to resell and securities sold
under agreements to repurchase at December 31, 2014 and 2013:
Net Amount
Presented in
Consolidated
Balance Sheets
(Dollars in millions) Gross
Amount Amount
Offset
Held/
Pledged
Financial
Instruments Net
Amount
December 31, 2014
Financial assets:
Securities borrowed or purchased under agreements to resell $1,122 $— $1,122 1,2 $1,112 $10
Financial liabilities:
Securities sold under agreements to repurchase 2,276 — 2,276 12,276 —
December 31, 2013
Financial assets:
Securities borrowed or purchased under agreements to resell $908 $— $908 1,2 $899 $9
Financial liabilities:
Securities sold under agreements to repurchase 1,759 — 1,759 11,759 —
1 None of the Company's repurchase or resell transactions met the right of setoff criteria for net balance sheet presentation at December 31, 2014 and 2013.
2 Excludes $38 million and $75 million of Fed funds sold which are not subject to a master netting agreement at December 31, 2014 and 2013, respectively.
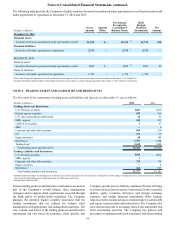
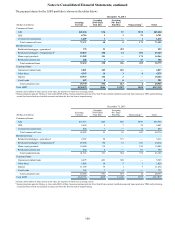
NOTE 4 - TRADING ASSETS AND LIABILITIES AND DERIVATIVES
The fair values of the components of trading assets and liabilities and derivatives at December 31 were as follows:
(Dollars in millions) 2014 2013
Trading Assets and Derivatives:
U.S. Treasury securities $267 $219
Federal agency securities 547 426
U.S. states and political subdivisions 42 65
MBS - agency 545 323
CDO/CLO securities 357
ABS —6
Corporate and other debt securities 509 534
CP 327 29
Equity securities 45 109
Derivatives 11,307 1,384
Trading loans 22,610 1,888
Total trading assets and derivatives $6,202 $5,040
Trading Liabilities and Derivatives:
U.S. Treasury securities $485 $472
MBS - agency 1—
Corporate and other debt securities 279 179
Equity securities —5
Derivatives 1462 525
Total trading liabilities and derivatives $1,227 $1,181
1 Amounts include the impact of offsetting cash collateral received from and paid to the same derivative counterparties and the impact of netting derivative assets and derivative liabilities
when a legally enforceable master netting agreement or similar agreement exists.
2 Includes loans related to TRS.
Various trading products and derivative instruments are used as
part of the Company’s overall balance sheet management
strategies and to support client requirements executed through
the Bank and/or its broker/dealer subsidiary. The Company
manages the potential market volatility associated with the
trading instruments that are utilized for balance sheet
management with appropriate risk management strategies. The
size, volume, and nature of the trading products and derivative
instruments can vary based on economic, client specific, and
Company specific asset or liability conditions. Product offerings
to clients include debt securities, loans traded in the secondary
market, equity securities, derivative and foreign exchange
contracts, and similar financial instruments. Other trading-
related activities include acting as a market maker in certain debt
and equity securities and related derivatives. The Company also
uses end user derivatives to manage interest rate and market risk
from non-trading activities. The Company has policies and
procedures to manage market risk associated with client trading