SunTrust 2014 Annual Report Download - page 83
Download and view the complete annual report
Please find page 83 of the 2014 SunTrust annual report below. You can navigate through the pages in the report by either clicking on the pages listed below, or by using the keyword search tool below to find specific information within the annual report.-
 1
1 -
2
-
3
-
4
-
5
-
6
-
7
-
8
-
9
-
10
-
11
-
12
-
13
-
14
-
15
-
16
-
17
-
18
-
19
-
20
-
21
-
22
-
23
-
24
-
25
-
26
-
27
-
28
-
29
-
30
-
31
-
32
-
33
-
34
-
35
-
36
-
37
-
38
-
39
-
40
-
41
-
42
-
43
-
44
-
45
-
46
-
47
-
48
-
49
-
50
-
51
-
52
-
53
-
54
-
55
-
56
-
57
-
58
-
59
-
60
-
61
-
62
-
63
-
64
-
65
-
66
-
67
-
68
-
69
-
70
-
71
-
72
-
 73
73 -
 74
74 -
 75
75 -
 76
76 -
 77
77 -
 78
78 -
 79
79 -
 80
80 -
 81
81 -
 82
82 -
 83
83 -
 84
84 -
 85
85 -
 86
86 -
 87
87 -
 88
88 -
 89
89 -
 90
90 -
 91
91 -
 92
92 -
 93
93 -
94
-
95
-
96
-
97
-
98
-
99
-
100
-
101
-
102
-
103
-
104
-
105
-
106
-
107
-
108
-
109
-
110
-
111
-
112
-
113
-
114
-
115
-
116
-
117
-
118
-
119
-
120
-
121
-
122
-
123
-
124
-
125
-
126
-
127
-
128
-
129
-
130
-
131
-
132
-
133
-
134
-
135
-
136
-
137
-
138
-
139
-
140
-
141
-
142
-
143
-
144
-
145
-
146
-
147
-
148
-
149
-
150
-
151
-
152
-
153
-
154
-
155
-
156
-
157
-
158
-
159
-
160
-
161
-
162
-
163
-
164
-
165
-
166
-
167
-
168
-
169
-
170
-
171
-
172
-
173
-
174
-
175
-
176
-
177
-
178
-
179
-
180
-
181
-
182
-
183
-
184
-
185
-
186
-
187
-
188
-
189
-
190
-
191
-
192
-
193
-
194
-
195
-
196
-
197
-
198
-
199
 |
 |

60
to the behavior of interest rates and spreads, the changes in
product balances, and the behavior of loan and deposit clients in
different rate environments. This analysis incorporates several
assumptions, the most material of which relate to the repricing
characteristics and balance fluctuations of deposits with
indeterminate or non-contractual maturities.
As the future path of interest rates cannot be known, we use
simulation analysis to project net interest income under various
scenarios including implied forward and deliberately extreme
and perhaps unlikely scenarios. The analyses may include rapid
and gradual ramping of interest rates, rate shocks, basis risk
analysis, and yield curve twists. Specific strategies are also
analyzed to determine their impact on net interest income levels
and sensitivities.
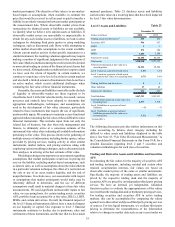
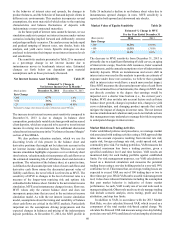
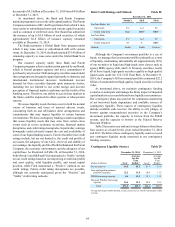
The sensitivity analysis presented in Table 25 is measured
as a percentage change in net interest income due to
instantaneous moves in benchmark interest rates. Estimated
changes set forth below are dependent upon material
assumptions such as those previously discussed.
Net Interest Income Asset Sensitivity Table 25
Estimated % Change in
Net Interest Income Over 12 Months 1
(Basis points) December 31, 2014 December 31, 2013
Rate Change
+200 6.7% 1.8%
+100 3.5% 1.0%
-25 (1.0)% (0.8)%
1 Estimated % change of net interest income is reflected on a non-FTE basis.
The increase in net interest income asset sensitivity compared to
December 31, 2013 is due to changes in balance sheet
composition, particularly variable rate loan growth and increased
client deposits, which are expected to be accretive to net interest
income in a rising rate environment. See additional discussion
related to net interest income in the "Net Interest Income/Margin"
section of this MD&A.
We also perform valuation analysis, which we use for
discerning levels of risk present in the balance sheet and
derivative positions that might not be taken into account in the
net interest income simulation horizon. Whereas net interest
income simulation highlights exposures over a relatively short
time horizon, valuation analysis incorporates all cash flows over
the estimated remaining life of all balance sheet and derivative
positions. The valuation of the balance sheet, at a point in time,
is defined as the discounted present value of asset cash flows and
derivative cash flows minus the discounted present value of
liability cash flows, the net of which is referred to as MVE. The
sensitivity of MVE to changes in the level of interest rates is a
measure of the longer-term repricing risk and options risk
embedded in the balance sheet. Similar to the net interest income
simulation, MVE uses instantaneous changes in rates. However,
MVE values only the current balance sheet and does not
incorporate projections that are used in the net interest income
simulation model. As with the net interest income simulation
model, assumptions about the timing and variability of balance
sheet cash flows are critical in the MVE analysis. Particularly
important are the assumptions driving prepayments and the
expected changes in balances and pricing of the indeterminate
deposit portfolios. At December 31, 2014, the MVE profile in
Table 26 indicated a decline in net balance sheet value due to
instantaneous upward changes in rates. MVE sensitivity is
reported in both upward and downward rate shocks.
Market Value of Equity Sensitivity Table 26
Estimated % Change in MVE
For the Year Ended December 31
(Basis points) 2014 2013
Rate Change
+200 (4.2)% (8.0)%
+100 (1.5)% (3.8)%
-25 0.1% 0.8%
The decrease in MVE sensitivity from December 31, 2013 is
primarily due to a significant flattening of yield curves, an aging
of interest rate swaps, fixed rate debt issuances, faster assumed
prepayments, and the annual assumption review of indeterminate
maturity deposits. While an instantaneous and severe shift in
interest rates was used in this analysis to provide an estimate of
exposure under these rate scenarios, we believe that a gradual
shift in interest rates would have a much more modest impact.
Since MVE measures the discounted present value of cash flows
over the estimated lives of instruments, the change in MVE does
not directly correlate to the degree that earnings would be
impacted over a shorter time horizon (i.e., the current year).
Further, MVE does not take into account factors such as future
balance sheet growth, changes in product mix, changes in yield
curve relationships, and changing product spreads that could
mitigate the impact of changes in interest rates. The net interest
income simulation and valuation analyses do not include actions
that management may undertake to manage this risk in response
to anticipated changes in interest rates.
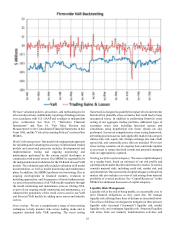
Market Risk from Trading Activities
Under established policies and procedures, we manage market
risk associated with trading activities using a VAR approach that
takes into account exposures resulting from interest rate risk,
equity risk, foreign exchange rate risk, credit spread risk, and
commodity price risk. For trading portfolios, VAR measures the
estimated maximum loss from a trading position, given a
specified confidence level and time horizon. VAR results are
monitored daily for each trading portfolio against established
limits. For risk management purposes, our VAR calculation is
based on a historical simulation and measures the potential
trading losses using a one-day holding period at a one-tail, 99%
confidence level. This means that, on average, trading losses are
expected to exceed VAR one out of 100 trading days or two to
three times per year. While VAR can be a useful risk management
tool, it does have inherent limitations including the assumption
that past market behavior is indicative of future market
performance. As such, VAR is only one of several tools used to
manage trading risk. Other tools used to actively manage trading
risk include scenario analysis, stress testing, profit and loss
attribution, and stop loss limits.
In addition to VAR, in accordance with the 2013 Market
Risk Rule, we also calculate Stressed VAR, which is used as a
component of the total market risk-based capital charge. We
calculate the Stressed VAR risk measure using a ten-day holding
period at a one-tail, 99% confidence level and employ a historical