SunTrust 2014 Annual Report Download - page 184
Download and view the complete annual report
Please find page 184 of the 2014 SunTrust annual report below. You can navigate through the pages in the report by either clicking on the pages listed below, or by using the keyword search tool below to find specific information within the annual report.-
 1
1 -
2
-
3
-
4
-
5
-
6
-
7
-
8
-
9
-
10
-
11
-
12
-
13
-
14
-
15
-
16
-
17
-
18
-
19
-
20
-
21
-
22
-
23
-
24
-
25
-
26
-
27
-
28
-
29
-
30
-
31
-
32
-
33
-
34
-
35
-
36
-
37
-
38
-
39
-
40
-
41
-
42
-
43
-
44
-
45
-
46
-
47
-
48
-
49
-
50
-
51
-
52
-
53
-
54
-
55
-
56
-
57
-
58
-
59
-
60
-
61
-
62
-
63
-
64
-
65
-
66
-
67
-
68
-
69
-
70
-
71
-
72
-
73
-
74
-
75
-
76
-
77
-
78
-
79
-
80
-
81
-
82
-
83
-
84
-
85
-
86
-
87
-
88
-
89
-
90
-
91
-
92
-
93
-
94
-
95
-
96
-
97
-
98
-
99
-
100
-
101
-
102
-
103
-
104
-
105
-
106
-
107
-
108
-
109
-
110
-
111
-
112
-
113
-
114
-
115
-
116
-
117
-
118
-
119
-
120
-
121
-
122
-
123
-
124
-
125
-
126
-
127
-
128
-
129
-
130
-
131
-
132
-
133
-
134
-
135
-
136
-
137
-
138
-
139
-
140
-
141
-
142
-
143
-
144
-
145
-
146
-
147
-
148
-
149
-
150
-
151
-
152
-
153
-
154
-
155
-
156
-
157
-
158
-
159
-
160
-
161
-
162
-
163
-
164
-
165
-
166
-
167
-
168
-
169
-
170
-
171
-
172
-
173
-
 174
174 -
 175
175 -
 176
176 -
 177
177 -
 178
178 -
 179
179 -
 180
180 -
 181
181 -
 182
182 -
 183
183 -
 184
184 -
 185
185 -
 186
186 -
 187
187 -
 188
188 -
 189
189 -
 190
190 -
 191
191 -
 192
192 -
 193
193 -
 194
194 -
195
-
196
-
197
-
198
-
199
 |
 |

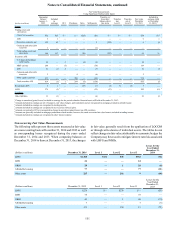
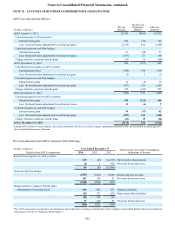
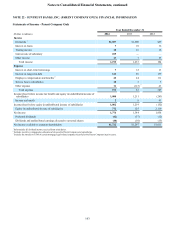
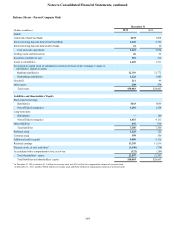
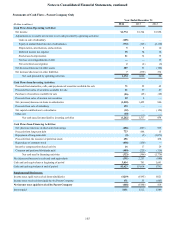
Notes to Consolidated Financial Statements, continued
161
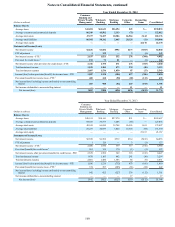
Year Ended December 31, 2012
(Dollars in millions)
Consumer
Banking and
Private Wealth
Management Wholesale
Banking Mortgage
Banking Corporate
Other Reconciling
Items Consolidated
Balance Sheets:
Average loans $41,823 $50,741 $30,288 $41 $— $122,893
Average consumer and commercial deposits 83,917 38,697 3,638 (3) — 126,249
Average total assets 47,022 63,296 35,153 28,317 2,346 176,134
Average total liabilities 84,662 46,618 4,484 20,039 (164) 155,639
Average total equity — — — — 20,495 20,495
Statements of Income/(Loss):
Net interest income $2,722 $1,531 $511 $397 ($59) $5,102
FTE adjustment — 119 — 4 — 123
Net interest income - FTE 12,722 1,650 511 401 (59) 5,225
Provision for credit losses 2583 193 618 1 — 1,395
Net interest income/(loss) after provision for credit losses - FTE 2,139 1,457 (107) 400 (59) 3,830
Total noninterest income 1,495 1,222 502 2,160 (6) 5,373
Total noninterest expense 3,082 1,627 1,369 211 (5) 6,284
Income/(loss) before provision/(benefit) for income taxes - FTE 552 1,052 (974) 2,349 (60) 2,919
Provision/(benefit) for income taxes - FTE 3203 333 (369) 781 (13) 935
Net income/(loss) including income attributable to noncontrolling
interest 349 719 (605) 1,568 (47) 1,984
Net income attributable to noncontrolling interest — — — 26 — 26
Net income/(loss) $349 $719 ($605) $1,542 ($47) $1,958
1 Presented on a matched maturity funds transfer price basis for the segments.
2 Provision for credit losses represents net charge-offs by segment combined with an allocation to the segments of the provision attributable to quarterly changes in the ALLL and unfunded
commitment reserve balances.
3 Includes regular income tax provision/(benefit) and taxable-equivalent income adjustment reversal.