SunTrust 2014 Annual Report Download - page 121
Download and view the complete annual report
Please find page 121 of the 2014 SunTrust annual report below. You can navigate through the pages in the report by either clicking on the pages listed below, or by using the keyword search tool below to find specific information within the annual report.-
 1
1 -
2
-
3
-
4
-
5
-
6
-
7
-
8
-
9
-
10
-
11
-
12
-
13
-
14
-
15
-
16
-
17
-
18
-
19
-
20
-
21
-
22
-
23
-
24
-
25
-
26
-
27
-
28
-
29
-
30
-
31
-
32
-
33
-
34
-
35
-
36
-
37
-
38
-
39
-
40
-
41
-
42
-
43
-
44
-
45
-
46
-
47
-
48
-
49
-
50
-
51
-
52
-
53
-
54
-
55
-
56
-
57
-
58
-
59
-
60
-
61
-
62
-
63
-
64
-
65
-
66
-
67
-
68
-
69
-
70
-
71
-
72
-
73
-
74
-
75
-
76
-
77
-
78
-
79
-
80
-
81
-
82
-
83
-
84
-
85
-
86
-
87
-
88
-
89
-
90
-
91
-
92
-
93
-
94
-
95
-
96
-
97
-
98
-
99
-
100
-
101
-
102
-
103
-
104
-
105
-
106
-
107
-
108
-
109
-
110
-
 111
111 -
 112
112 -
 113
113 -
 114
114 -
 115
115 -
 116
116 -
 117
117 -
 118
118 -
 119
119 -
 120
120 -
 121
121 -
 122
122 -
 123
123 -
 124
124 -
 125
125 -
 126
126 -
 127
127 -
 128
128 -
 129
129 -
 130
130 -
 131
131 -
132
-
133
-
134
-
135
-
136
-
137
-
138
-
139
-
140
-
141
-
142
-
143
-
144
-
145
-
146
-
147
-
148
-
149
-
150
-
151
-
152
-
153
-
154
-
155
-
156
-
157
-
158
-
159
-
160
-
161
-
162
-
163
-
164
-
165
-
166
-
167
-
168
-
169
-
170
-
171
-
172
-
173
-
174
-
175
-
176
-
177
-
178
-
179
-
180
-
181
-
182
-
183
-
184
-
185
-
186
-
187
-
188
-
189
-
190
-
191
-
192
-
193
-
194
-
195
-
196
-
197
-
198
-
199
 |
 |
Notes to Consolidated Financial Statements, continued
98
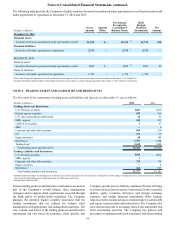
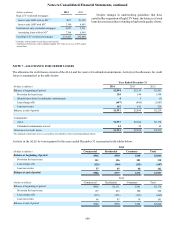
NOTE 6 - LOANS
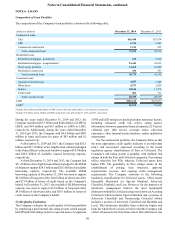
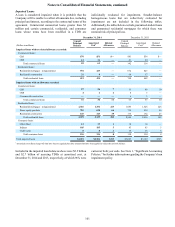
Composition of Loan Portfolio
The composition of the Company's loan portfolio is shown in the following table:
(Dollars in millions) December 31, 2014 December 31, 2013
Commercial loans:
C&I $65,440 $57,974
CRE 6,741 5,481
Commercial construction 1,211 855
Total commercial loans 73,392 64,310
Residential loans:
Residential mortgages - guaranteed 632 3,416
Residential mortgages - nonguaranteed 123,443 24,412
Home equity products 14,264 14,809
Residential construction 436 553
Total residential loans 38,775 43,190
Consumer loans:
Guaranteed student loans 4,827 5,545
Other direct 4,573 2,829
Indirect 10,644 11,272
Credit cards 901 731
Total consumer loans 20,945 20,377
LHFI $133,112 $127,877
LHFS 2$3,232 $1,699
1 Includes $272 million and $302 million of LHFI carried at fair value at December 31, 2014 and 2013, respectively.
2 Includes $1.9 billion and $1.4 billion of LHFS carried at fair value at December 31, 2014 and 2013, respectively.
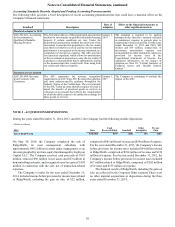
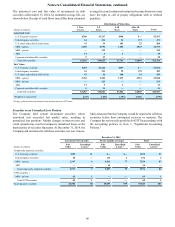
During the years ended December 31, 2014 and 2013, the
Company transferred $3.3 billion and $280 million in LHFI to
LHFS, and $44 million and $43 million in LHFS to LHFI,
respectively. Additionally, during the years ended December
31, 2014 and 2013, the Company sold $4.0 billion and $807
million in loans and leases for gains of $83 million and $1
million, respectively.
At December 31, 2014 and 2013, the Company had $26.5
billion and $27.1 billion of net eligible loan collateral pledged
to the Federal Reserve discount window to support $18.4 billion
and $20.8 billion of available, unused borrowing capacity,
respectively.
At both December 31, 2014 and 2013, the Company had
$31.2 billion of net eligible loan collateral pledged to the FHLB
of Atlanta to support $24.3 billion and $20.1 billion of available
borrowing capacity, respectively. The available FHLB
borrowing capacity at December 31, 2014 was used to support
$4.0 billion of long-term debt, $4.0 billion of short-term debt,
and $7.9 billion of letters of credit issued on the Company's
behalf. At December 31, 2013, the available FHLB borrowing
capacity was used to support $3.0 billion of long-term debt,
$4.0 billion of short-term debt, and $853 million of letters of
credit issued on the Company's behalf.
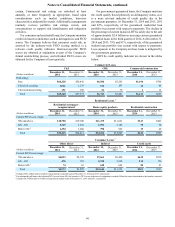
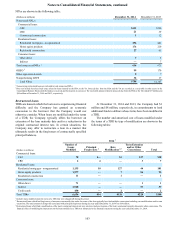
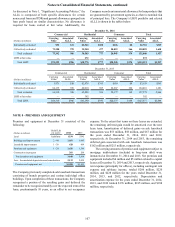
Credit Quality Evaluation
The Company evaluates the credit quality of its loan portfolio
by employing a dual internal risk rating system, which assigns
both PD and LGD ratings to derive expected losses. Assignment
of PD and LGD ratings are predicated upon numerous factors,
including consumer credit risk scores, rating agency
information, borrower/guarantor financial capacity, LTV ratios,
collateral type, debt service coverage ratios, collection
experience, other internal metrics/analyses, and/or qualitative
assessments.
For the commercial portfolio, the Company believes that
the most appropriate credit quality indicator is an individual
loan’s risk assessment expressed according to the broad
regulatory agency classifications of Pass or Criticized. The
Company's risk rating system is granular, with multiple risk
ratings in both the Pass and Criticized categories. Pass ratings
reflect relatively low PDs, whereas, Criticized assets have
higher PDs. The granularity in Pass ratings assists in the
establishment of pricing, loan structures, approval
requirements, reserves, and ongoing credit management
requirements. The Company conforms to the following
regulatory classifications for Criticized assets: Other Assets
Especially Mentioned (or Special Mention), Adversely
Classified, Doubtful, and Loss. However, for the purposes of
disclosure, management believes the most meaningful
distinction within the Criticized categories is between Accruing
Criticized (which includes Special Mention and a portion of
Adversely Classified) and Nonaccruing Criticized (which
includes a portion of Adversely Classified and Doubtful and
Loss). This distinction identifies those relatively higher risk
loans for which there is a basis to believe that the Company will
collect all amounts due from those where full collection is less