SunTrust 2014 Annual Report Download - page 156
Download and view the complete annual report
Please find page 156 of the 2014 SunTrust annual report below. You can navigate through the pages in the report by either clicking on the pages listed below, or by using the keyword search tool below to find specific information within the annual report.-
 1
1 -
2
-
3
-
4
-
5
-
6
-
7
-
8
-
9
-
10
-
11
-
12
-
13
-
14
-
15
-
16
-
17
-
18
-
19
-
20
-
21
-
22
-
23
-
24
-
25
-
26
-
27
-
28
-
29
-
30
-
31
-
32
-
33
-
34
-
35
-
36
-
37
-
38
-
39
-
40
-
41
-
42
-
43
-
44
-
45
-
46
-
47
-
48
-
49
-
50
-
51
-
52
-
53
-
54
-
55
-
56
-
57
-
58
-
59
-
60
-
61
-
62
-
63
-
64
-
65
-
66
-
67
-
68
-
69
-
70
-
71
-
72
-
73
-
74
-
75
-
76
-
77
-
78
-
79
-
80
-
81
-
82
-
83
-
84
-
85
-
86
-
87
-
88
-
89
-
90
-
91
-
92
-
93
-
94
-
95
-
96
-
97
-
98
-
99
-
100
-
101
-
102
-
103
-
104
-
105
-
106
-
107
-
108
-
109
-
110
-
111
-
112
-
113
-
114
-
115
-
116
-
117
-
118
-
119
-
120
-
121
-
122
-
123
-
124
-
125
-
126
-
127
-
128
-
129
-
130
-
131
-
132
-
133
-
134
-
135
-
136
-
137
-
138
-
139
-
140
-
141
-
142
-
143
-
144
-
145
-
 146
146 -
 147
147 -
 148
148 -
 149
149 -
 150
150 -
 151
151 -
 152
152 -
 153
153 -
 154
154 -
 155
155 -
 156
156 -
 157
157 -
 158
158 -
 159
159 -
 160
160 -
 161
161 -
 162
162 -
 163
163 -
 164
164 -
 165
165 -
 166
166 -
167
-
168
-
169
-
170
-
171
-
172
-
173
-
174
-
175
-
176
-
177
-
178
-
179
-
180
-
181
-
182
-
183
-
184
-
185
-
186
-
187
-
188
-
189
-
190
-
191
-
192
-
193
-
194
-
195
-
196
-
197
-
198
-
199
 |
 |

Notes to Consolidated Financial Statements, continued
133
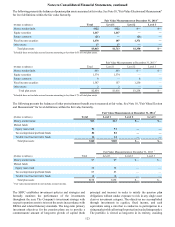
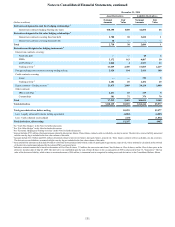
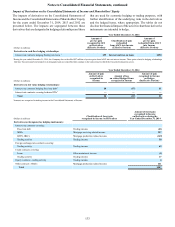
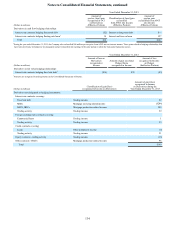
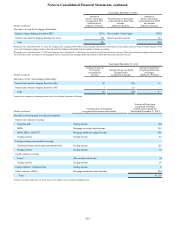
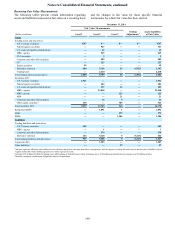
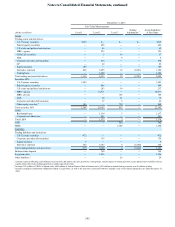
Impact of Derivatives on the Consolidated Statements of Income and Shareholders’ Equity
The impacts of derivatives on the Consolidated Statements of
Income and the Consolidated Statements of Shareholders’ Equity
for the years ended December 31, 2014, 2013 and 2012 are
presented below. The impacts are segregated between those
derivatives that are designated in hedging relationships and those
that are used for economic hedging or trading purposes, with
further identification of the underlying risks in the derivatives
and the hedged items, where appropriate. The tables do not
disclose the financial impact of the activities that these derivative
instruments are intended to hedge.
Year Ended December 31, 2014
(Dollars in millions)
Amount of
pre-tax gain
recognized in OCI
on Derivatives
(Effective Portion)
Classification of gain
reclassified
from AOCI into Income
(Effective Portion)
Amount of
pre-tax gain
reclassified from AOCI
into Income
(Effective Portion)
Derivatives in cash flow hedging relationships:
Interest rate contracts hedging floating rate loans 1$99 Interest and fees on loans $290
1 During the year ended December 31, 2014, the Company also reclassified $97 million of pre-tax gains from AOCI into net interest income. These gains related to hedging relationships
that have been previously terminated or de-designated and are reclassified into earnings in the same period in which the forecasted transaction occurs.
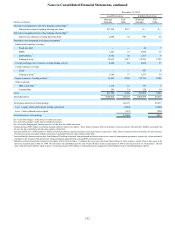
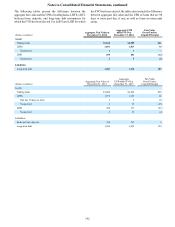
Year Ended December 31, 2014
(Dollars in millions)
Amount of gain
on Derivatives
recognized in
Income
Amount of loss
on related Hedged Items
recognized in Income
Amount of gain
recognized in Income
on Hedges
(Ineffective Portion)
Derivatives in fair value hedging relationships:
Interest rate contracts hedging fixed rate debt 1$8 ($7) $1
Interest rate contracts covering brokered CDs 1— — —
Total $8 ($7) $1
1 Amounts are recognized in trading income in the Consolidated Statements of Income.
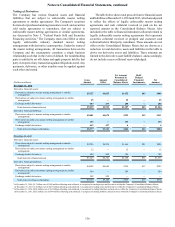
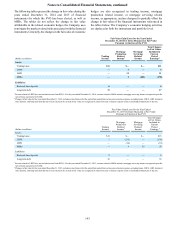
(Dollars in millions) Classification of (loss)/gain
recognized in Income on Derivatives
Amount of (loss)/gain
recognized in Income
on Derivatives during the
Year Ended December 31, 2014
Derivatives not designated as hedging instruments:
Interest rate contracts covering:
Fixed rate debt Trading income ($1)
MSRs Mortgage servicing related income 257
LHFS, IRLCs Mortgage production related income (149)
Trading activity Trading income 50
Foreign exchange rate contracts covering:
Trading activity Trading income 69
Credit contracts covering:
Loans Other noninterest income (1)
Trading activity Trading income 17
Equity contracts - trading activity Trading income 4
Other contracts - IRLCs Mortgage production related income 261
Total $507