SunTrust 2014 Annual Report Download - page 169
Download and view the complete annual report
Please find page 169 of the 2014 SunTrust annual report below. You can navigate through the pages in the report by either clicking on the pages listed below, or by using the keyword search tool below to find specific information within the annual report.-
 1
1 -
2
-
3
-
4
-
5
-
6
-
7
-
8
-
9
-
10
-
11
-
12
-
13
-
14
-
15
-
16
-
17
-
18
-
19
-
20
-
21
-
22
-
23
-
24
-
25
-
26
-
27
-
28
-
29
-
30
-
31
-
32
-
33
-
34
-
35
-
36
-
37
-
38
-
39
-
40
-
41
-
42
-
43
-
44
-
45
-
46
-
47
-
48
-
49
-
50
-
51
-
52
-
53
-
54
-
55
-
56
-
57
-
58
-
59
-
60
-
61
-
62
-
63
-
64
-
65
-
66
-
67
-
68
-
69
-
70
-
71
-
72
-
73
-
74
-
75
-
76
-
77
-
78
-
79
-
80
-
81
-
82
-
83
-
84
-
85
-
86
-
87
-
88
-
89
-
90
-
91
-
92
-
93
-
94
-
95
-
96
-
97
-
98
-
99
-
100
-
101
-
102
-
103
-
104
-
105
-
106
-
107
-
108
-
109
-
110
-
111
-
112
-
113
-
114
-
115
-
116
-
117
-
118
-
119
-
120
-
121
-
122
-
123
-
124
-
125
-
126
-
127
-
128
-
129
-
130
-
131
-
132
-
133
-
134
-
135
-
136
-
137
-
138
-
139
-
140
-
141
-
142
-
143
-
144
-
145
-
146
-
147
-
148
-
149
-
150
-
151
-
152
-
153
-
154
-
155
-
156
-
157
-
158
-
 159
159 -
 160
160 -
 161
161 -
 162
162 -
 163
163 -
 164
164 -
 165
165 -
 166
166 -
 167
167 -
 168
168 -
 169
169 -
 170
170 -
 171
171 -
 172
172 -
 173
173 -
 174
174 -
 175
175 -
 176
176 -
 177
177 -
 178
178 -
 179
179 -
180
-
181
-
182
-
183
-
184
-
185
-
186
-
187
-
188
-
189
-
190
-
191
-
192
-
193
-
194
-
195
-
196
-
197
-
198
-
199
 |
 |
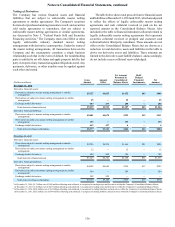
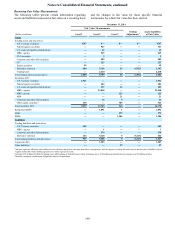
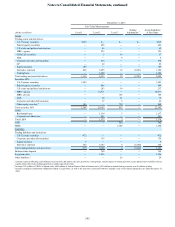
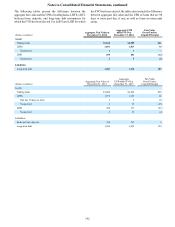
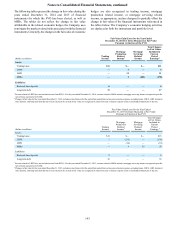
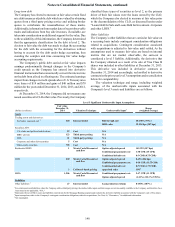
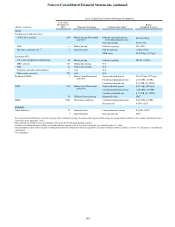
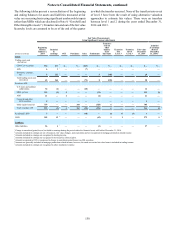
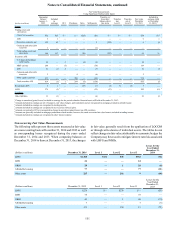
Notes to Consolidated Financial Statements, continued
146
market assumptions at a mid-market valuation point, with
appropriate valuation adjustments for liquidity and credit risk.
To this end, the Company has evaluated liquidity premiums
required by market participants, as well as the credit risk of its
counterparties and its own credit. The Company has considered
factors such as the likelihood of default by itself and its
counterparties, its net exposures, and remaining maturities in
determining the appropriate fair value adjustments to record.
See Note 17, “Derivative Financial Instruments,” for additional
information on the Company's derivative contracts.
The Company's level 3 derivatives include IRLCs that
satisfy the criteria to be treated as derivative financial
instruments. The fair value of IRLCs on residential LHFS, while
based on interest rates observable in the market, is highly
dependent on the ultimate closing of the loans. These “pull-
through” rates are based on the Company’s historical data and
reflect the Company’s best estimate of the likelihood that a
commitment will ultimately result in a closed loan. As pull-
through rates increase, the fair value of IRLCs also increases.
Servicing value is included in the fair value of IRLCs, and the
fair value of servicing is determined by projecting cash flows,
which are then discounted to estimate an expected fair value.
The fair value of servicing is impacted by a variety of factors,
including prepayment assumptions, discount rates, delinquency
rates, contractually specified servicing fees, servicing costs, and
underlying portfolio characteristics. Because these inputs are
not transparent in market trades, IRLCs are considered to be
level 3 assets. During the years ended December 31, 2014 and
2013, the Company transferred $245 million and $222 million,
respectively, of net IRLCs out of level 3 as the associated loans
were closed.
Trading loans
The Company engages in certain businesses whereby the
election to measure loans at fair value for financial reporting
aligns with the underlying business purpose. Specifically, the
loans that are included within this classification are: (i) loans
made or acquired in connection with the Company’s TRS
business, (ii) loans backed by the SBA, and (iii) the loan sales
and trading business within the Company’s Wholesale Banking
segment. See Note 10, "Certain Transfers of Financial Assets
and Variable Interest Entities," and Note 17, “Derivative
Financial Instruments,” for further discussion of this business.
All of these loans are classified as level 2, due to the market data
that the Company uses in the estimate of fair value.
The loans made in connection with the Company’s TRS
business are short-term, demand loans, whereby the repayment
is senior in priority and whose value is collateralized. While
these loans do not trade in the market, the Company believes
that the par amount of the loans approximates fair value and no
unobservable assumptions are used by the Company to value
these loans. At December 31, 2014 and 2013, the Company had
outstanding $2.3 billion and $1.5 billion, respectively, of such
short-term loans carried at fair value.
SBA loans are similar to SBA securities discussed herein
under “Federal agency securities,” except for their legal form.
In both cases, the Company trades instruments that are fully
guaranteed by the U.S. government as to contractual principal
and interest and there is sufficient observable trading activity
upon which to base the estimate of fair value. As these SBA
loans are fully guaranteed, the changes in fair value are
attributable to factors other than instrument-specific credit risk.
The loans from the Company’s sales and trading business
are commercial and corporate leveraged loans that are either
traded in the market or for which similar loans trade. The
Company elected to measure these loans at fair value since they
are actively traded. For the years ended December 31, 2014,
2013, and 2012, the Company recognized an immaterial amount
of gains in the Consolidated Statements of Income due to
changes in fair value attributable to instrument-specific credit
risk. The Company is able to obtain fair value estimates for
substantially all of these loans through a third party valuation
service that is broadly used by market participants. While most
of the loans are traded in the market, the Company does not
believe that trading activity qualifies the loans as level 1
instruments, as the volume and level of trading activity is subject
to variability and the loans are not exchange-traded. The
Company believes that level 2 is a more appropriate presentation
of the underlying market activity for the loans. At December 31,
2014 and 2013, $284 million and $313 million, respectively, of
loans related to the Company’s trading business were held in
inventory.
Loans Held for Sale and Loans Held for Investment
Residential LHFS
The Company values certain newly-originated mortgage LHFS
predominantly at fair value based upon defined product criteria.
The Company chooses to fair value these mortgage LHFS to
eliminate the complexities and inherent difficulties of achieving
hedge accounting and to better align reported results with the
underlying economic changes in value of the loans and related
hedge instruments. Origination fees and costs are recognized in
earnings when earned or incurred. The servicing value is
included in the fair value of the loan and initially recognized at
the time the Company enters into IRLCs with borrowers. The
Company uses derivatives to economically hedge changes in
interest rates and servicing value in the fair value of the loan.
The mark-to-market adjustments related to LHFS and the
associated economic hedges are captured in mortgage
production related income.
Level 2 LHFS are primarily agency loans which trade in
active secondary markets and are priced using current market
pricing for similar securities adjusted for servicing, interest rate
risk, and credit risk. Non-agency residential mortgages are also
included in level 2 LHFS. Transfers of certain mortgage LHFS
into level 3 during the years ended December 31, 2014 and 2013
were not due to using alternative valuation approaches, but were
largely due to borrower defaults or the identification of other
loan defects impacting the marketability of the loans.
For residential loans that the Company has elected to
measure at fair value, the Company considers the component of
the fair value changes due to instrument-specific credit risk,
which is intended to be an approximation of the fair value change
attributable to changes in borrower-specific credit risk. For the
years ended December 31, 2014 and 2013, gains or losses the
Company recognized in the Consolidated Statements of Income
due to changes in fair value attributable to borrower-specific
credit risk were immaterial. For the year ended December 31,
2012, gains the Company recognized in the Consolidated
Statements of Income due to changes in fair value attributable