SunTrust 2014 Annual Report Download - page 103
Download and view the complete annual report
Please find page 103 of the 2014 SunTrust annual report below. You can navigate through the pages in the report by either clicking on the pages listed below, or by using the keyword search tool below to find specific information within the annual report.-
 1
1 -
2
-
3
-
4
-
5
-
6
-
7
-
8
-
9
-
10
-
11
-
12
-
13
-
14
-
15
-
16
-
17
-
18
-
19
-
20
-
21
-
22
-
23
-
24
-
25
-
26
-
27
-
28
-
29
-
30
-
31
-
32
-
33
-
34
-
35
-
36
-
37
-
38
-
39
-
40
-
41
-
42
-
43
-
44
-
45
-
46
-
47
-
48
-
49
-
50
-
51
-
52
-
53
-
54
-
55
-
56
-
57
-
58
-
59
-
60
-
61
-
62
-
63
-
64
-
65
-
66
-
67
-
68
-
69
-
70
-
71
-
72
-
73
-
74
-
75
-
76
-
77
-
78
-
79
-
80
-
81
-
82
-
83
-
84
-
85
-
86
-
87
-
88
-
89
-
90
-
91
-
92
-
 93
93 -
 94
94 -
 95
95 -
 96
96 -
 97
97 -
 98
98 -
 99
99 -
 100
100 -
 101
101 -
 102
102 -
 103
103 -
 104
104 -
 105
105 -
 106
106 -
 107
107 -
 108
108 -
 109
109 -
 110
110 -
 111
111 -
 112
112 -
 113
113 -
114
-
115
-
116
-
117
-
118
-
119
-
120
-
121
-
122
-
123
-
124
-
125
-
126
-
127
-
128
-
129
-
130
-
131
-
132
-
133
-
134
-
135
-
136
-
137
-
138
-
139
-
140
-
141
-
142
-
143
-
144
-
145
-
146
-
147
-
148
-
149
-
150
-
151
-
152
-
153
-
154
-
155
-
156
-
157
-
158
-
159
-
160
-
161
-
162
-
163
-
164
-
165
-
166
-
167
-
168
-
169
-
170
-
171
-
172
-
173
-
174
-
175
-
176
-
177
-
178
-
179
-
180
-
181
-
182
-
183
-
184
-
185
-
186
-
187
-
188
-
189
-
190
-
191
-
192
-
193
-
194
-
195
-
196
-
197
-
198
-
199
 |
 |

80
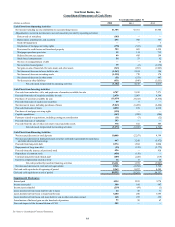
SunTrust Banks, Inc.
Consolidated Statements of Income
Year Ended December 31
(Dollars in millions and shares in thousands, except per share data) 2014 2013 2012
Interest Income
Interest and fees on loans $4,617 $4,633 $5,035
Interest and fees on loans held for sale 78 107 112
Interest and dividends on securities available for sale 613 579 655
Trading account interest and other 76 69 65
Total interest income 5,384 5,388 5,867
Interest Expense
Interest on deposits 235 291 429
Interest on long-term debt 270 210 299
Interest on other borrowings 39 34 37
Total interest expense 544 535 765
Net interest income 4,840 4,853 5,102
Provision for credit losses 342 553 1,395
Net interest income after provision for credit losses 4,498 4,300 3,707
Noninterest Income
Service charges on deposit accounts 645 657 676
Other charges and fees 368 369 402
Card fees 320 310 316
Trust and investment management income 423 518 512
Retail investment services 297 267 241
Investment banking income 404 356 342
Trading income 182 182 211
Mortgage production related income 201 314 343
Mortgage servicing related income 196 87 260
Gain on sale of subsidiary 105 — —
Net securities (losses)/gains (15) 2 1,974
Other noninterest income 197 152 96
Total noninterest income 3,323 3,214 5,373
Noninterest Expense
Employee compensation 2,576 2,488 2,603
Employee benefits 386 413 474
Outside processing and software 741 746 710
Operating losses 441 503 277
Net occupancy expense 340 348 359
Regulatory assessments 142 181 233
Equipment expense 169 181 188
Marketing and customer development 134 135 184
Credit and collection services 91 264 239
Consulting and legal fees 72 73 165
Amortization 25 23 46
Other real estate (income)/expense (4) 4 140
Net loss on debt extinguishment —— 16
Other noninterest expense 1430 472 650
Total noninterest expense 5,543 5,831 6,284
Income before provision for income taxes 2,278 1,683 2,796
Provision for income taxes 1493 322 812
Net income including income attributable to noncontrolling interest 1,785 1,361 1,984
Net income attributable to noncontrolling interest 11 17 26
Net income $1,774 $1,344 $1,958
Net income available to common shareholders $1,722 $1,297 $1,931
Net income per average common share:
Diluted $3.23 $2.41 $3.59
Basic 3.26 2.43 3.62
Dividends declared per common share 0.70 0.35 0.20
Average common shares - diluted 533,391 539,093 538,061
Average common shares - basic 527,500 534,283 534,149
1 Amortization expense related to qualified affordable housing investment costs is recognized in provision for income taxes for each of the periods presented as allowed by an accounting
standard adopted in 2014. Prior to 2014, these amounts were recognized in other noninterest expense.
See Notes to Consolidated Financial Statements.