SunTrust 2014 Annual Report Download - page 52
Download and view the complete annual report
Please find page 52 of the 2014 SunTrust annual report below. You can navigate through the pages in the report by either clicking on the pages listed below, or by using the keyword search tool below to find specific information within the annual report.-
 1
1 -
2
-
3
-
4
-
5
-
6
-
7
-
8
-
9
-
10
-
11
-
12
-
13
-
14
-
15
-
16
-
17
-
18
-
19
-
20
-
21
-
22
-
23
-
24
-
25
-
26
-
27
-
28
-
29
-
30
-
31
-
32
-
33
-
34
-
35
-
36
-
37
-
38
-
39
-
40
-
41
-
 42
42 -
 43
43 -
 44
44 -
 45
45 -
 46
46 -
 47
47 -
 48
48 -
 49
49 -
 50
50 -
 51
51 -
 52
52 -
 53
53 -
 54
54 -
 55
55 -
 56
56 -
 57
57 -
 58
58 -
 59
59 -
 60
60 -
 61
61 -
 62
62 -
63
-
64
-
65
-
66
-
67
-
68
-
69
-
70
-
71
-
72
-
73
-
74
-
75
-
76
-
77
-
78
-
79
-
80
-
81
-
82
-
83
-
84
-
85
-
86
-
87
-
88
-
89
-
90
-
91
-
92
-
93
-
94
-
95
-
96
-
97
-
98
-
99
-
100
-
101
-
102
-
103
-
104
-
105
-
106
-
107
-
108
-
109
-
110
-
111
-
112
-
113
-
114
-
115
-
116
-
117
-
118
-
119
-
120
-
121
-
122
-
123
-
124
-
125
-
126
-
127
-
128
-
129
-
130
-
131
-
132
-
133
-
134
-
135
-
136
-
137
-
138
-
139
-
140
-
141
-
142
-
143
-
144
-
145
-
146
-
147
-
148
-
149
-
150
-
151
-
152
-
153
-
154
-
155
-
156
-
157
-
158
-
159
-
160
-
161
-
162
-
163
-
164
-
165
-
166
-
167
-
168
-
169
-
170
-
171
-
172
-
173
-
174
-
175
-
176
-
177
-
178
-
179
-
180
-
181
-
182
-
183
-
184
-
185
-
186
-
187
-
188
-
189
-
190
-
191
-
192
-
193
-
194
-
195
-
196
-
197
-
198
-
199
 |
 |
29
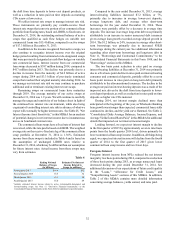
stock as part of a longer-term process to optimize the mix
between common and non-common Tier 1 capital.
Separately, our LCR at December 31, 2014 exceeds the
January 1, 2016, 90% requirement. The cumulative actions we
have taken to improve our risk and earnings profile, combined
with our strong capital and liquidity levels, should help us to
further increase capital returns to shareholders. See additional
discussion of our capital and liquidity position in the "Capital
Resources" and "Liquidity Risk Management" sections of this
MD&A.
Business Segments Highlights
Consumer Banking and Private Wealth Management
Consumer Banking and Private Wealth Management net income
was up 7% compared to 2013, driven by higher revenue and a
lower provision for credit losses, partially offset by higher
expenses. Total revenue increased 2% compared to 2013, driven
primarily by growth in wealth management-related fees. This
reflects our increased investments in people, tools, and
technology to drive higher revenue growth across our affluent
and high net worth client segments. These investments were also
the primary drivers of the growth in expenses compared to 2013.
We believe our results in this business demonstrate good
execution of the core strategic initiatives we have outlined in the
past, which include improving wealth-management related
income, enhancing the growth and returns of our consumer
lending portfolio, and making critical investments in talent and
technology. For 2015, we are focused on continuing our core
revenue momentum; however, expense discipline will also
remain important, as we continue to balance cost reduction
opportunities with selective investments for growth.
Wholesale Banking
Wholesale Banking remains a key growth engine for us, and we
gained momentum in that business in 2014. For the year, average
client deposits increased 10% and capital markets-related fees
were up 9%. Net income also increased compared to 2013, driven
by solid revenue growth and a lower provision for credit losses.
Fees were up modestly, as lower trading and leasing income,
combined with the exit of a legacy affordable housing
partnership, were more than offset by double-digit growth in
investment banking income. Our investment banking
performance in 2014 reflects broad-based growth, with record
or near-record results across debt and equity capital markets, as
well as in mergers and acquisitions advisory services. The
success of our platform reflects our continued investment in
talent to expand and diversify our capabilities. We are confident
that Wholesale Banking is poised for further growth in 2015.
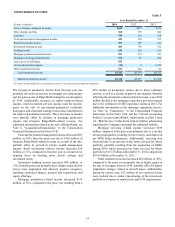
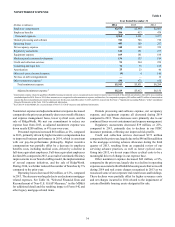
Mortgage Banking
Over the past year, our core Mortgage business demonstrated
steady improvement. This progress was driven by our efforts to
normalize our cost base and improve our risk profile. Through
these efforts, we are now able to more firmly focus on the core
strategies in place to meet more client needs, drive higher
revenue, and deliver incremental efficiency improvement.
Mortgage Banking's core profitability for full year 2014 was
driven primarily by a 30% reduction in noninterest expense
compared to the prior year. Our 2014 efficiency ratio improved
significantly from 2013 to 102%, and excluding the $324 million
of Form 8-K and other legacy mortgage-related items presented
in Table 1 and Table 34, the efficiency ratio declined to below
75% for 2014. Revenue declined modestly, as growth in net
interest income was more than offset by a decline in fee income.
Core mortgage production income declined approximately 50%
compared to the prior year; however, mortgage servicing income
more than doubled, driven mainly by lower prepayments in the
servicing portfolio and increased service fees resulting from
servicing portfolio acquisitions in 2014.
Additional information related to our segments can be found in
Note 20, "Business Segment Reporting," to the Consolidated
Financial Statements in this Form 10-K, and further discussion
of segment results for 2014 and 2013 can be found in the
"Business Segment Results" section of this MD&A.