SunTrust 2014 Annual Report Download - page 57
Download and view the complete annual report
Please find page 57 of the 2014 SunTrust annual report below. You can navigate through the pages in the report by either clicking on the pages listed below, or by using the keyword search tool below to find specific information within the annual report.-
 1
1 -
2
-
3
-
4
-
5
-
6
-
7
-
8
-
9
-
10
-
11
-
12
-
13
-
14
-
15
-
16
-
17
-
18
-
19
-
20
-
21
-
22
-
23
-
24
-
25
-
26
-
27
-
28
-
29
-
30
-
31
-
32
-
33
-
34
-
35
-
36
-
37
-
38
-
39
-
40
-
41
-
42
-
43
-
44
-
45
-
46
-
 47
47 -
 48
48 -
 49
49 -
 50
50 -
 51
51 -
 52
52 -
 53
53 -
 54
54 -
 55
55 -
 56
56 -
 57
57 -
 58
58 -
 59
59 -
 60
60 -
 61
61 -
 62
62 -
 63
63 -
 64
64 -
 65
65 -
 66
66 -
 67
67 -
68
-
69
-
70
-
71
-
72
-
73
-
74
-
75
-
76
-
77
-
78
-
79
-
80
-
81
-
82
-
83
-
84
-
85
-
86
-
87
-
88
-
89
-
90
-
91
-
92
-
93
-
94
-
95
-
96
-
97
-
98
-
99
-
100
-
101
-
102
-
103
-
104
-
105
-
106
-
107
-
108
-
109
-
110
-
111
-
112
-
113
-
114
-
115
-
116
-
117
-
118
-
119
-
120
-
121
-
122
-
123
-
124
-
125
-
126
-
127
-
128
-
129
-
130
-
131
-
132
-
133
-
134
-
135
-
136
-
137
-
138
-
139
-
140
-
141
-
142
-
143
-
144
-
145
-
146
-
147
-
148
-
149
-
150
-
151
-
152
-
153
-
154
-
155
-
156
-
157
-
158
-
159
-
160
-
161
-
162
-
163
-
164
-
165
-
166
-
167
-
168
-
169
-
170
-
171
-
172
-
173
-
174
-
175
-
176
-
177
-
178
-
179
-
180
-
181
-
182
-
183
-
184
-
185
-
186
-
187
-
188
-
189
-
190
-
191
-
192
-
193
-
194
-
195
-
196
-
197
-
198
-
199
 |
 |

34
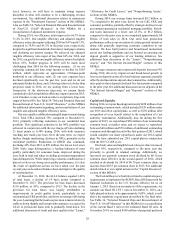
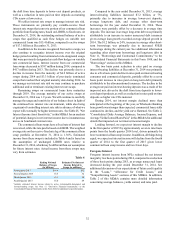
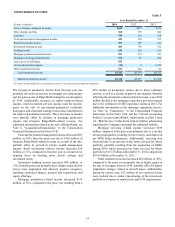
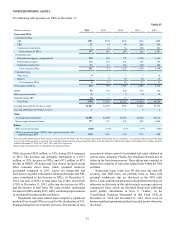
NONINTEREST EXPENSE Table 6
Year Ended December 31
(Dollars in millions) 2014 2013 2012
Employee compensation $2,576 $2,488 $2,603
Employee benefits 386 413 474
Personnel expenses 2,962 2,901 3,077
Outside processing and software 741 746 710
Operating losses 441 503 277
Net occupancy expense 340 348 359
Regulatory assessments 142 181 233
Equipment expense 169 181 188
Marketing and customer development 134 135 184
Credit and collection services 91 264 239
Consulting and legal fees 72 73 165
Amortization 25 23 46
Other real estate (income)/expense (4) 4 140
Net loss on debt extinguishment —— 16
Other noninterest expense 1 430 472 650
Total noninterest expense $5,543 $5,831 $6,284
Adjusted noninterest expense 2$5,219 $5,412 $6,150
1 Amortization expense related to qualified affordable housing investment costs is recognized in provision for income taxes for each of the periods presented as allowed by an accounting
standard adopted in 2014. Prior to 2014, these amounts were recognized in other noninterest expense, and therefore, for comparative purposes, $49 million and $39 million of amortization
expense has been reclassified to provision for income taxes for the years ended December 31, 2013 and 2012, respectively. See Note 1, "Significant Accounting Policies," to the Consolidated
Financial Statements in this Form 10-K for additional information.
2 See Table 34 in this MD&A for a reconcilement of Non-U.S. GAAP measures and additional information.
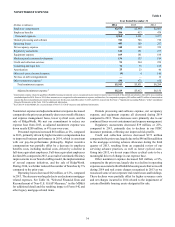
Noninterest expense and adjusted noninterest expense decreased
compared to the prior year, primarily due to our overall efficiency
and expense management focus, lower cyclical costs, and the
sale of RidgeWorth. We met our commitment to reduce our
expense base from 2013, as adjusted noninterest expense was
down nearly $200 million, or 4% year-over-year.
Personnel expenses increased $61 million, or 2%, compared
to 2013, primarily driven by higher incentive compensation due
to improved business performance in 2014, which is consistent
with our pay-for-performance philosophy. Higher incentive
compensation was partially offset by a decrease in employee
benefits costs, including medical costs, driven by a decline in
full-time equivalent employees. Full-time equivalent employees
declined 6% compared to 2013, as a result of continued efficiency
improvements in our branch staffing model, the implementation
of several expense initiatives, and the sale of RidgeWorth.
During 2014, we further reduced the number of branches by 3%
compared to the prior year.
Operating losses decreased $62 million, or 12%, compared
to 2013. The decrease was largely due to a reduction in mortgage-
related expenses. See Table 34, "Selected Financial Data and
Reconcilement of Non-U.S. GAAP Measures," in this MD&A
for additional detail and the resulting impact of Form 8-K and
other legacy mortgage-related items.
Outside processing and software expense, net occupancy
expense, and equipment expense all decreased during 2014
compared to 2013. These decreases were primarily due to our
continued focus on cost containment and expense management.
Regulatory assessments decreased $39 million, or 22%,
compared to 2013, primarily due to declines in our FDIC
insurance premium, reflecting our improved risk profile.
Credit and collection services decreased $173 million
compared to the prior year, largely due to the $96 million addition
to the mortgage servicing advance allowance during the third
quarter of 2013, resulting from an expanded review of our
servicing advance practices, as well as lower cyclical costs.
Going into 2015, we do not expect these cyclical costs to be a
meaningful driver of change in our expense base.
Other noninterest expense decreased $42 million, or 9%,
compared to the prior year, largely due to a decline in operating
expenses associated with affordable housing assets that were sold
during 2014 and real estate charges recognized in 2013 as we
reassessed some of our corporate real estate leases and holdings.
These declines were partially offset by higher severance costs
and net charges incurred in 2014 related to the impairment of
certain affordable housing assets designated for sale.