SunTrust 2014 Annual Report Download - page 58
Download and view the complete annual report
Please find page 58 of the 2014 SunTrust annual report below. You can navigate through the pages in the report by either clicking on the pages listed below, or by using the keyword search tool below to find specific information within the annual report.-
 1
1 -
2
-
3
-
4
-
5
-
6
-
7
-
8
-
9
-
10
-
11
-
12
-
13
-
14
-
15
-
16
-
17
-
18
-
19
-
20
-
21
-
22
-
23
-
24
-
25
-
26
-
27
-
28
-
29
-
30
-
31
-
32
-
33
-
34
-
35
-
36
-
37
-
38
-
39
-
40
-
41
-
42
-
43
-
44
-
45
-
46
-
47
-
 48
48 -
 49
49 -
 50
50 -
 51
51 -
 52
52 -
 53
53 -
 54
54 -
 55
55 -
 56
56 -
 57
57 -
 58
58 -
 59
59 -
 60
60 -
 61
61 -
 62
62 -
 63
63 -
 64
64 -
 65
65 -
 66
66 -
 67
67 -
 68
68 -
69
-
70
-
71
-
72
-
73
-
74
-
75
-
76
-
77
-
78
-
79
-
80
-
81
-
82
-
83
-
84
-
85
-
86
-
87
-
88
-
89
-
90
-
91
-
92
-
93
-
94
-
95
-
96
-
97
-
98
-
99
-
100
-
101
-
102
-
103
-
104
-
105
-
106
-
107
-
108
-
109
-
110
-
111
-
112
-
113
-
114
-
115
-
116
-
117
-
118
-
119
-
120
-
121
-
122
-
123
-
124
-
125
-
126
-
127
-
128
-
129
-
130
-
131
-
132
-
133
-
134
-
135
-
136
-
137
-
138
-
139
-
140
-
141
-
142
-
143
-
144
-
145
-
146
-
147
-
148
-
149
-
150
-
151
-
152
-
153
-
154
-
155
-
156
-
157
-
158
-
159
-
160
-
161
-
162
-
163
-
164
-
165
-
166
-
167
-
168
-
169
-
170
-
171
-
172
-
173
-
174
-
175
-
176
-
177
-
178
-
179
-
180
-
181
-
182
-
183
-
184
-
185
-
186
-
187
-
188
-
189
-
190
-
191
-
192
-
193
-
194
-
195
-
196
-
197
-
198
-
199
 |
 |

35
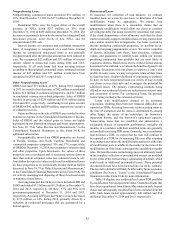
LOANS
Our disclosures about the credit quality of our loan portfolio and
the related credit reserves (i) describe the nature of credit risk
inherent in our loan portfolio, (ii) provide information on how
we analyze and assess credit risk in arriving at an adequate and
appropriate ALLL, and (iii) explain the changes in the ALLL and
reasons for those changes.
We report our loan portfolio in three loan segments:
commercial, residential, and consumer. Loans are assigned to
these segments based upon the type of borrower, purpose,
collateral, and/or our underlying credit management processes.
Additionally, within each loan segment, we have identified loan
types, which further disaggregate loans based upon common
characteristics.
Commercial
The C&I loan type includes loans to fund business operations or
activities, loans secured by owner-occupied properties,
corporate credit cards, and other wholesale lending activities.
CRE and commercial construction loan types include investor
loans where repayment is largely dependent upon the operation,
refinance, or sale of the underlying real estate. Commercial loans
and construction loans secured by owner-occupied properties are
classified as C&I loans, as the primary source of loan repayment
for owner-occupied properties is business income and not real
estate operations.
Residential
Residential mortgages consist of loans secured by 1-4 family
homes, mostly prime first-lien loans, both government-
guaranteed and nonguaranteed. Residential construction loans
include owner-occupied residential lot loans and construction-
to-perm loans. Home equity products consist of equity lines of
credit and closed-end equity loans that may be in either a first
lien or junior lien position.
Consumer
The loan types comprising our consumer loan segment include
government-guaranteed student loans, other direct loans
(consisting primarily of direct auto loans, loans secured by
negotiable collateral, unsecured loans and private student loans),
indirect loans (consisting of loans secured by automobiles, boats,
and recreational vehicles), and consumer credit cards.
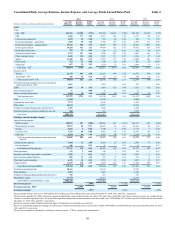
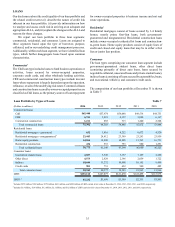
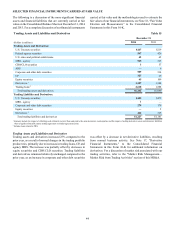
The composition of our loan portfolio at December 31 is shown
in Table 7:
Loan Portfolio by Types of Loans Table 7
(Dollars in millions) 2014 2013 2012 2011 2010
Commercial loans:
C&I $65,440 $57,974 $54,048 $49,538 $44,753
CRE 6,741 5,481 4,127 5,094 6,167
Commercial construction 1,211 855 713 1,240 2,568
Total commercial loans 73,392 64,310 58,888 55,872 53,488
Residential loans:
Residential mortgages - guaranteed 632 3,416 4,252 6,672 4,520
Residential mortgages - nonguaranteed 123,443 24,412 23,389 23,243 23,959
Home equity products 14,264 14,809 14,805 15,765 16,751
Residential construction 436 553 753 980 1,291
Total residential loans 38,775 43,190 43,199 46,660 46,521
Consumer loans:
Guaranteed student loans 4,827 5,545 5,357 7,199 4,260
Other direct 4,573 2,829 2,396 2,059 1,722
Indirect 10,644 11,272 10,998 10,165 9,499
Credit cards 901 731 632 540 485
Total consumer loans 20,945 20,377 19,383 19,963 15,966
LHFI $133,112 $127,877 $121,470 $122,495 $115,975
LHFS 2$3,232 $1,699 $3,399 $2,353 $3,501
1 Includes $272 million, $302 million, $379 million, $431 million, and $488 million of LHFI carried at fair value at December 31, 2014, 2013, 2012, 2011, and 2010, respectively.
2 Includes $1.9 billion, $1.4 billion, $3.2 billion, $2.1 billion, and $3.2 billion of LHFS carried at fair value at December 31, 2014, 2013, 2012, 2011, and 2010, respectively.