SunTrust 2014 Annual Report Download - page 71
Download and view the complete annual report
Please find page 71 of the 2014 SunTrust annual report below. You can navigate through the pages in the report by either clicking on the pages listed below, or by using the keyword search tool below to find specific information within the annual report.-
 1
1 -
2
-
3
-
4
-
5
-
6
-
7
-
8
-
9
-
10
-
11
-
12
-
13
-
14
-
15
-
16
-
17
-
18
-
19
-
20
-
21
-
22
-
23
-
24
-
25
-
26
-
27
-
28
-
29
-
30
-
31
-
32
-
33
-
34
-
35
-
36
-
37
-
38
-
39
-
40
-
41
-
42
-
43
-
44
-
45
-
46
-
47
-
48
-
49
-
50
-
51
-
52
-
53
-
54
-
55
-
56
-
57
-
58
-
59
-
60
-
 61
61 -
 62
62 -
 63
63 -
 64
64 -
 65
65 -
 66
66 -
 67
67 -
 68
68 -
 69
69 -
 70
70 -
 71
71 -
 72
72 -
 73
73 -
 74
74 -
 75
75 -
 76
76 -
 77
77 -
 78
78 -
 79
79 -
 80
80 -
 81
81 -
82
-
83
-
84
-
85
-
86
-
87
-
88
-
89
-
90
-
91
-
92
-
93
-
94
-
95
-
96
-
97
-
98
-
99
-
100
-
101
-
102
-
103
-
104
-
105
-
106
-
107
-
108
-
109
-
110
-
111
-
112
-
113
-
114
-
115
-
116
-
117
-
118
-
119
-
120
-
121
-
122
-
123
-
124
-
125
-
126
-
127
-
128
-
129
-
130
-
131
-
132
-
133
-
134
-
135
-
136
-
137
-
138
-
139
-
140
-
141
-
142
-
143
-
144
-
145
-
146
-
147
-
148
-
149
-
150
-
151
-
152
-
153
-
154
-
155
-
156
-
157
-
158
-
159
-
160
-
161
-
162
-
163
-
164
-
165
-
166
-
167
-
168
-
169
-
170
-
171
-
172
-
173
-
174
-
175
-
176
-
177
-
178
-
179
-
180
-
181
-
182
-
183
-
184
-
185
-
186
-
187
-
188
-
189
-
190
-
191
-
192
-
193
-
194
-
195
-
196
-
197
-
198
-
199
 |
 |
48
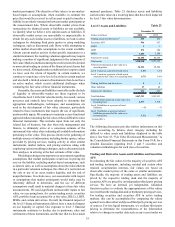
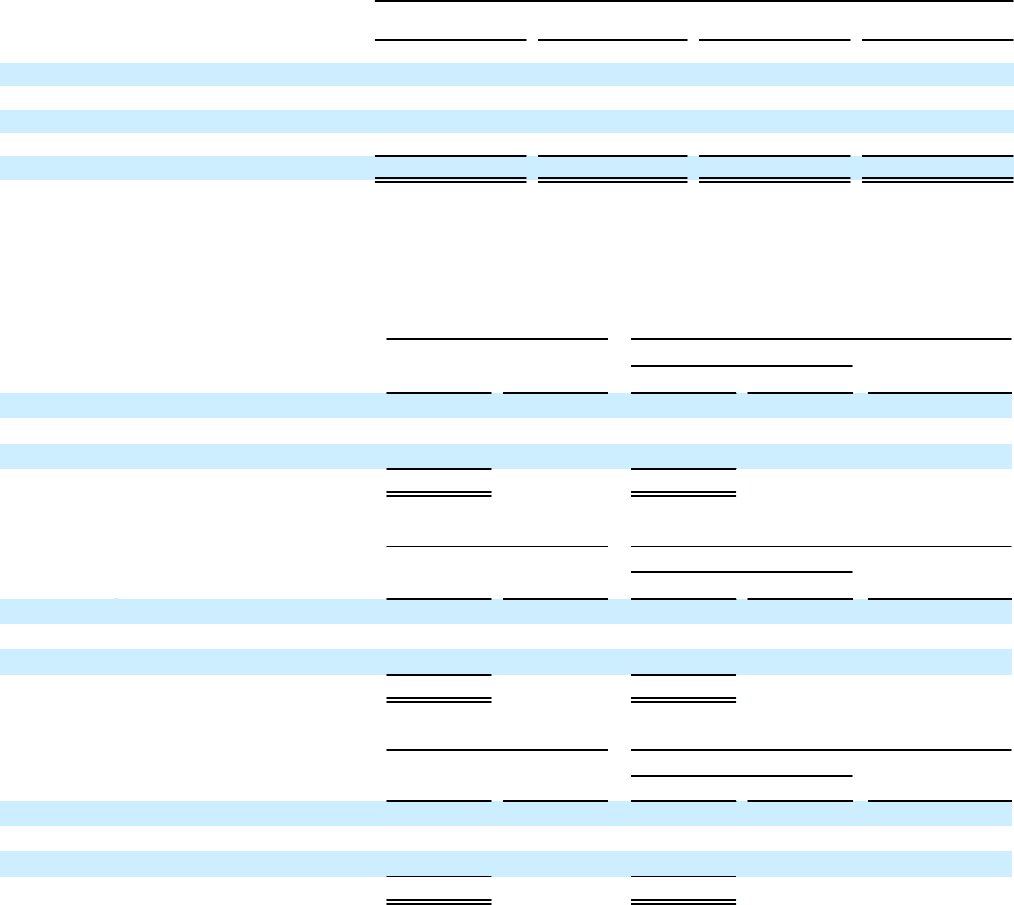
Maturity of Consumer Time and Other Time Deposits in Amounts of $100,000 or More Table 19
At December 31, 2014
(Dollars in millions) Consumer
Time Brokered
Time Foreign
Time Total
Months to Maturity:
3 or less $952 $103 $375 $1,430
Over 3 through 6 560 44 — 604
Over 6 through 12 610 16 — 626
Over 12 1,871 795 — 2,666
Total $3,993 $958 $375 $5,326
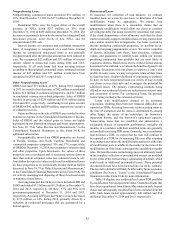
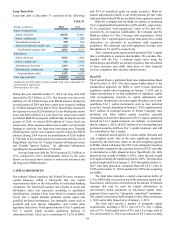
BORROWINGS
Short-Term Borrowings Table 20
December 31, 2014 Year Ended December 31, 2014
Balance Rate
Daily Average Maximum
Outstanding at
any Month-End
(Dollars in millions) Balance Rate
Funds purchased 1$1,276 0.06% $931 0.09% $1,375
Securities sold under agreements to repurchase 12,276 0.22 2,202 0.14 2,323
Other short-term borrowings 5,634 0.21 6,135 0.23 7,283
Total $9,186 $9,268
December 31, 2013 Year Ended December 31, 2013
Balance Rate
Daily Average Maximum
Outstanding at
any Month-End
(Dollars in millions) Balance Rate
Funds purchased 1$1,192 0.07% $639 0.10% $1,192
Securities sold under agreements to repurchase 11,759 0.10 1,857 0.14 1,911
Other short-term borrowings 5,788 0.22 4,953 0.26 5,868
Total $8,739 $7,449
December 31, 2012 Year Ended December 31, 2012
Balance Rate
Daily Average Maximum
Outstanding at
any Month-End
(Dollars in millions) Balance Rate
Funds purchased 1$617 0.09% $798 0.11% $925
Securities sold under agreements to repurchase 11,574 0.18 1,602 0.18 1,781
Other short-term borrowings 3,303 0.31 6,952 0.27 10,697
Total $5,494 $9,352
1 Funds purchased and securities sold under agreements to repurchase mature overnight or at a fixed maturity generally not exceeding three months. Rates on overnight funds reflect current
market rates. Rates on fixed maturity borrowings are set at the time of the borrowings.
Our total period-end short-term borrowings at December 31,
2014 increased $447 million, or 5%, from December 31, 2013,
primarily due to a $517 million increase in securities sold under
agreements to repurchase, partially offset by a decrease in other
short-term borrowings of $154 million. The decrease in other
short-term borrowings was primarily due to a $274 million
decline in master notes, offset by an increase of $122 million in
dealer collateral held.
For the year ended December 31, 2014, our total daily
average short-term borrowings increased $1.8 billion, or 24%,
compared to the year ended December 31, 2013. The increase
was largely driven by increases in other short-term borrowings
of $1.2 billion, largely due to a $1.0 billion increase in FHLB
advances, and securities sold under agreements to repurchase of
$345 million due to ordinary balance sheet management
practices. For the year ended December 31, 2014, our maximum
outstanding balance at any month-end for other short-term
borrowings was higher than our period-end balance primarily
due to maturities of FHLB advances toward the end of the year.