SunTrust 2014 Annual Report Download - page 91
Download and view the complete annual report
Please find page 91 of the 2014 SunTrust annual report below. You can navigate through the pages in the report by either clicking on the pages listed below, or by using the keyword search tool below to find specific information within the annual report.-
 1
1 -
2
-
3
-
4
-
5
-
6
-
7
-
8
-
9
-
10
-
11
-
12
-
13
-
14
-
15
-
16
-
17
-
18
-
19
-
20
-
21
-
22
-
23
-
24
-
25
-
26
-
27
-
28
-
29
-
30
-
31
-
32
-
33
-
34
-
35
-
36
-
37
-
38
-
39
-
40
-
41
-
42
-
43
-
44
-
45
-
46
-
47
-
48
-
49
-
50
-
51
-
52
-
53
-
54
-
55
-
56
-
57
-
58
-
59
-
60
-
61
-
62
-
63
-
64
-
65
-
66
-
67
-
68
-
69
-
70
-
71
-
72
-
73
-
74
-
75
-
76
-
77
-
78
-
79
-
80
-
 81
81 -
 82
82 -
 83
83 -
 84
84 -
 85
85 -
 86
86 -
 87
87 -
 88
88 -
 89
89 -
 90
90 -
 91
91 -
 92
92 -
 93
93 -
 94
94 -
 95
95 -
 96
96 -
 97
97 -
 98
98 -
 99
99 -
 100
100 -
 101
101 -
102
-
103
-
104
-
105
-
106
-
107
-
108
-
109
-
110
-
111
-
112
-
113
-
114
-
115
-
116
-
117
-
118
-
119
-
120
-
121
-
122
-
123
-
124
-
125
-
126
-
127
-
128
-
129
-
130
-
131
-
132
-
133
-
134
-
135
-
136
-
137
-
138
-
139
-
140
-
141
-
142
-
143
-
144
-
145
-
146
-
147
-
148
-
149
-
150
-
151
-
152
-
153
-
154
-
155
-
156
-
157
-
158
-
159
-
160
-
161
-
162
-
163
-
164
-
165
-
166
-
167
-
168
-
169
-
170
-
171
-
172
-
173
-
174
-
175
-
176
-
177
-
178
-
179
-
180
-
181
-
182
-
183
-
184
-
185
-
186
-
187
-
188
-
189
-
190
-
191
-
192
-
193
-
194
-
195
-
196
-
197
-
198
-
199
 |
 |
68
invest in talent to better meet our clients’ needs and augment our
capabilities, along with a reduction to incentive compensation
accruals in the first quarter of 2013. Other expenses increased
due to our strategic decision to sell certain legacy investments
in affordable housing partnerships in the first quarter of 2014
that resulted in a net $21 million impairment charge during 2014.
These increases in expense were partially offset by a decrease
in operating losses driven by a $32 million settlement of legal
matters during the third quarter of 2013 and lower affordable
housing partnership expense.
Mortgage Banking
Mortgage Banking reported a net loss of $56 million for the year
ended December 31, 2014, compared to a net loss of $527 million
for 2013. During 2014, results included $324 million of pre-tax
charges as described in the Form 8-K and other legacy mortgage-
related items. Net income as adjusted for those charges would
have been $147 million for the year ended December 31, 2014.
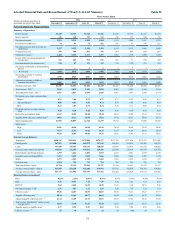
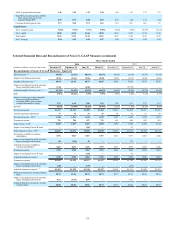
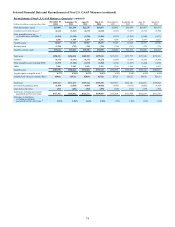
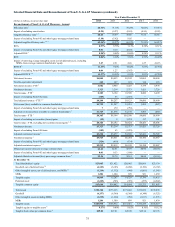
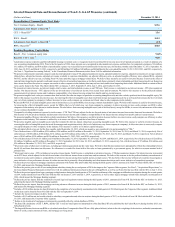
See Table 34, "Selected Financial Data and Reconcilement of
Non-U.S. GAAP Measures," and the "Executive Overview" in
this MD&A where Form 8-K and other legacy mortgage-related
items are described.
Net interest income was $552 million, an increase of $13
million, or 2%, predominantly due to higher net interest income
on loans, partially offset by a decline net interest income on
LHFS and deposits. Net interest income on loans increased $37
million mainly due to an increase in loan spreads. This increase
was partially offset by a $10 million decline in interest income
on LHFS due to a $0.7 billion, or 29%, decrease in average
balances which was driven by lower production volume during
2014, partially negated by higher spreads. Additionally, a $14
million decline in income on average deposits was driven by a
$0.9 billion, or 27%, decline in average total deposit balances,
partially offset by higher spreads.
Provision for credit losses was $81 million, a decrease of
$89 million, or 52%, compared to 2013. The improvement was
largely attributable to improved credit quality.
Total noninterest income was $473 million, an increase of
$71 million, or 18%, compared to 2013. The increase was
predominantly driven by higher mortgage servicing and other
income, partially offset by lower mortgage production income.
Mortgage servicing income of $196 million increased $109
million, driven by lower decay, higher servicing fees and
improved net MSR hedge performance. Loans serviced for
others were $115.5 billion at December 31, 2014 compared with
$106.8 billion at December 31, 2013, up 8%. The increase was
largely attributable to the purchase of MSRs during 2014.
Mortgage loan production income decreased $113 million due
to a decline in production volume driven by lower refinance
volume, as well as gain on sale margins, partially offset by a
$102 million decline in the mortgage repurchase provision. The
mortgage repurchase provision in the third quarter of 2013
included $63 million related to the settlement of certain
repurchase claims with the GSEs. Loan origination volume was
$16.4 billion for the year ended December 31, 2014, compared
to $29.9 billion for 2013, a decrease of $13.5 billion, or 45%.
Other income increased $75 million, predominantly driven by
gains on the sale of $2.0 billion of government-guaranteed
mortgages that were transferred to LHFS during the second
quarter of 2014 and subsequently sold during the third quarter
of 2014, as well as gains on government-guaranteed loans that
were sold in the second quarter of 2014.
Total noninterest expense was $1.1 billion, a decline of $453
million, or 30%, compared to the same period in 2013. Operating
losses and collection services decreased $200 million due to a
$291 million charge to settle specific mortgage-related legal
matters and a $96 million charge related to the increase in our
allowance for servicing advances, both recognized in the third
quarter of 2013, in addition to a decline in other operating losses.
These specific 2013 charges were offset by $324 million of
expenses for mortgage-related legal matters in 2014;
specifically, HAMP-related charges net of the impact of the
progression of other legal-related matters during 2014 and a $145
million legal provision. Total staff expense declined $120 million
driven by lower staffing levels reflecting the decline in loan
production volumes and ongoing efforts to improve productivity.
In addition, lower mortgage production volumes resulted in
declines in outside processing cost of $33 million and credit
services of $22 million. Additionally, total allocated expense
decreased $47 million during 2014.
Corporate Other
Corporate Other net income during the year ended December 31,
2014 was $436 million, a decrease of $83 million, or 16%,
compared to 2013. The decrease in income was primarily due to
a decline in net interest income and a reduction in the amount of
tax benefits resulting from the recognition of discrete items
during 2013.
Net interest income during 2014 was $276 million, a
decrease of $41 million, or 13%, compared to 2013. The decrease
was primarily due to a $31 million decline in commercial loan
related swap income and $7 million foregone RidgeWorth net
interest income. Average long-term debt increased by $2.4
billion, or 27%, and average short-term borrowings increased by
$1.7 billion, or 45%, compared to 2013, driven by balance sheet
management activities.
Total noninterest income was $238 million, a decrease of
$3 million, or 1%, compared to 2013. The decrease was primarily
due to foregone RidgeWorth trust and investment management
income and a $17 million increase in losses on the sale of AFS
securities driven by a repositioning of the AFS portfolio during
2014. These declines were substantially offset by a $105 million
gain on sale of RidgeWorth during the second quarter of 2014.
Total noninterest expense was $87 million, an increase of
$1 million, or 1%, compared to 2013. The increase was mainly
due to higher severance cost and incentive compensation related
to business performance, higher debt issuance costs, and the
lower recovery of allocated internal costs. Additionally,
operating losses increased due to the reversal of a loss accrual
during 2013. These increases were offset by a reduction in
expenses due to sale of RidgeWorth.
Years Ended December 31, 2013 vs. 2012
Consumer Banking and Private Wealth Management
Consumer Banking and Private Wealth Management reported
net income of $642 million during the year ended December 31,
2013, an increase of $293 million, or 84%, compared to 2012.
The increase in net income was driven by continued
improvement in credit quality resulting in a lower provision for