SunTrust 2014 Annual Report Download - page 51
Download and view the complete annual report
Please find page 51 of the 2014 SunTrust annual report below. You can navigate through the pages in the report by either clicking on the pages listed below, or by using the keyword search tool below to find specific information within the annual report.-
 1
1 -
2
-
3
-
4
-
5
-
6
-
7
-
8
-
9
-
10
-
11
-
12
-
13
-
14
-
15
-
16
-
17
-
18
-
19
-
20
-
21
-
22
-
23
-
24
-
25
-
26
-
27
-
28
-
29
-
30
-
31
-
32
-
33
-
34
-
35
-
36
-
37
-
38
-
39
-
40
-
 41
41 -
 42
42 -
 43
43 -
 44
44 -
 45
45 -
 46
46 -
 47
47 -
 48
48 -
 49
49 -
 50
50 -
 51
51 -
 52
52 -
 53
53 -
 54
54 -
 55
55 -
 56
56 -
 57
57 -
 58
58 -
 59
59 -
 60
60 -
 61
61 -
62
-
63
-
64
-
65
-
66
-
67
-
68
-
69
-
70
-
71
-
72
-
73
-
74
-
75
-
76
-
77
-
78
-
79
-
80
-
81
-
82
-
83
-
84
-
85
-
86
-
87
-
88
-
89
-
90
-
91
-
92
-
93
-
94
-
95
-
96
-
97
-
98
-
99
-
100
-
101
-
102
-
103
-
104
-
105
-
106
-
107
-
108
-
109
-
110
-
111
-
112
-
113
-
114
-
115
-
116
-
117
-
118
-
119
-
120
-
121
-
122
-
123
-
124
-
125
-
126
-
127
-
128
-
129
-
130
-
131
-
132
-
133
-
134
-
135
-
136
-
137
-
138
-
139
-
140
-
141
-
142
-
143
-
144
-
145
-
146
-
147
-
148
-
149
-
150
-
151
-
152
-
153
-
154
-
155
-
156
-
157
-
158
-
159
-
160
-
161
-
162
-
163
-
164
-
165
-
166
-
167
-
168
-
169
-
170
-
171
-
172
-
173
-
174
-
175
-
176
-
177
-
178
-
179
-
180
-
181
-
182
-
183
-
184
-
185
-
186
-
187
-
188
-
189
-
190
-
191
-
192
-
193
-
194
-
195
-
196
-
197
-
198
-
199
 |
 |
28
level; however, we will have to maintain strong expense
discipline in what will continue to be a challenging revenue
environment. See additional discussion related to noninterest
expense in the "Noninterest Expense" section of this MD&A.
Also see Table 34, "Selected Financial Data and Reconcilement
of Non-U.S. GAAP Measures," in this MD&A for a
reconciliation of adjusted noninterest expense.
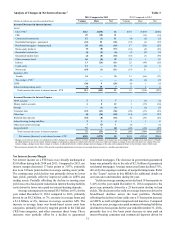
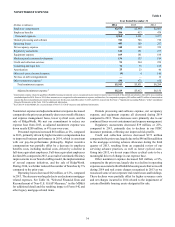
During 2014, our efficiency ratio improved to 66.7% from
71.2% in 2013. Our tangible efficiency and adjusted tangible
efficiency ratios also improved during 2014 to 66.4% and 63.3%,
compared to 70.9% and 65.3% in the prior year, respectively,
despite the significant headwinds from lower mortgage volumes
and declining net interest margin. We achieved our adjusted
tangible efficiency ratio target of less than 64% for 2014, and
for 2015, our goal is for our tangible efficiency ratio to be slightly
below 63%. Further progress in 2015 will be much more
challenging than 2014 for the following reasons: (1) we are
expecting commercial loan swap income to decline by $185
million, which represents an approximate 150-basis-point
headwind to our efficiency ratio; (2) our core expenses have
declined significantly over the past few years and we do not
anticipate further declines; and (3) having achieved a better than
projected result in 2014, we are starting from a lower base.
Irrespective of the short-term trajectory, we remain firmly
committed to delivering further efficiency improvement in 2015,
even if modest, to stay on track to achieve our primary long-term
target of below 60%. See Table 34, "Selected Financial Data and
Reconcilement of Non-U.S. GAAP Measures," in this MD&A
for additional information regarding, and reconciliations of, our
tangible and adjusted tangible efficiency ratios.
Our asset quality exhibited meaningful improvement during
2014. Total NPLs declined 35% compared to December 31,
2013, primarily reflecting reductions in our residential loan
portfolio. This significant reduction in the NPL portfolio was
achieved in conjunction with the net charge-off ratio declining
21 basis points to 0.34% during 2014, with both measures
reaching new multi-year lows. Over the near term, we expect
further, though moderating, declines in NPLs, primarily in the
residential portfolio. Reductions in OREO also continued,
declining 42% from 2013 to $99 million, the lowest level since
2006. Early stage delinquencies, a leading indicator of asset
quality, particularly for consumer loans, improved during the
year, both in total and when excluding government-guaranteed
loan delinquencies. While improving economic conditions have
played a role in our strong asset quality performance, it is also
the result of significant actions we have taken over the past
several years to de-risk our balance sheet and improve the quality
of our production.
At December 31, 2014, the ALLL balance equaled 1.46%
of total loans, a decline of 14 basis points compared to
December 31, 2013. The provision for loan losses decreased
$210 million, or 38%, compared to 2013. The decline in the
provision for loan losses was largely attributable to
improvements in credit quality trends, particularly in our
residential and CRE portfolios, and lower net charge-offs during
the year. Assuming that the loan loss provision remains relatively
stable to down slightly and loan growth continues, we expect the
ALLL to period-end loans ratio to gradually trend down. See
additional discussion of credit and asset quality in the “Loans,”
“Allowance for Credit Losses,” and “Nonperforming Assets,”
sections of this MD&A.
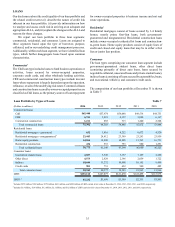
During 2014, our average loans increased $8.2 billion, or
7%, compared to the prior year, driven by our C&I, CRE, and
consumer portfolios, partially offset by strategic declines in our
government-guaranteed residential mortgage portfolio. Period-
end loans increased at a lower rate of 4%, or $5.2 billion,
compared to the prior year, as we completed approximately $4
billion of loan sales in 2014. Our solid loan production
performance reflects our execution of certain growth initiatives
along with generally improving economic conditions in our
markets. We have built positive and broad-based momentum
across our lending platforms and are focused on ensuring our
deposit growth is supportive of our lending initiatives. See
additional loan discussion in the “Loans,” “Nonperforming
Assets,” and "Net Interest Income/Margin" sections of this
MD&A.
Average consumer and commercial deposits increased 4%
during 2014, driven by improved and broad-based growth in
lower cost deposits across all of our business segments, partially
offset by declines in time deposits due to maturities. Additionally,
rates paid on these deposits declined five basis points compared
to the prior year. See additional discussion on our deposits in the
"Net Interest Income/Margin" and "Deposits" sections of this
MD&A.
Capital and Liquidity
During 2014, we repurchased approximately $458 million of our
outstanding common stock, which included $328 million under
our 2013 and 2014 capital plans, as well as $130 million after
recognition of a tax benefit related to the completion of a tax
authority examination. Additionally, thus far during the first
quarter of 2015, we repurchased $50 million of our outstanding
common stock at market value and we expect to repurchase
between $60 million and $70 million of additional outstanding
common stock through the end of the first quarter of 2015, which
would complete our share repurchases under our 2014 capital
plan. We have submitted our 2015 capital plan in conjunction
with the 2015 CCAR cycle.
Our book value and tangible book value per share increased
8% and 10%, respectively, compared to the prior year due
primarily to growth in retained earnings. Additionally, we
increased our quarterly common stock dividend by $0.10 per
common share effective in the second quarter of 2014, which
resulted in dividends for 2014 of $0.70 per common share, an
increase from $0.35 per common share in 2013. See additional
details related to our capital actions in the “Capital Resources”
section of this MD&A.
The Federal Reserve's final rules related to capital adequacy
requirements to implement the BCBS's Basel III framework for
financial institutions in the U.S. became effective for us on
January 1, 2015. Based on our analysis of the requirements, we
estimate our Basel III CET 1 ratio at December 31, 2014, on a
fully phased-in basis, to be approximately 9.69%, which is well
above the regulatory requirement prescribed by the final rules.
See Table 34, "Selected Financial Data and Reconcilement of
Non-U.S. GAAP Measures" in this MD&A for a reconciliation
of the current Basel I ratio to the estimated Basel III ratio. In
November 2014, we issued $500 million of perpetual preferred