SunTrust 2014 Annual Report Download - page 95
Download and view the complete annual report
Please find page 95 of the 2014 SunTrust annual report below. You can navigate through the pages in the report by either clicking on the pages listed below, or by using the keyword search tool below to find specific information within the annual report.-
 1
1 -
2
-
3
-
4
-
5
-
6
-
7
-
8
-
9
-
10
-
11
-
12
-
13
-
14
-
15
-
16
-
17
-
18
-
19
-
20
-
21
-
22
-
23
-
24
-
25
-
26
-
27
-
28
-
29
-
30
-
31
-
32
-
33
-
34
-
35
-
36
-
37
-
38
-
39
-
40
-
41
-
42
-
43
-
44
-
45
-
46
-
47
-
48
-
49
-
50
-
51
-
52
-
53
-
54
-
55
-
56
-
57
-
58
-
59
-
60
-
61
-
62
-
63
-
64
-
65
-
66
-
67
-
68
-
69
-
70
-
71
-
72
-
73
-
74
-
75
-
76
-
77
-
78
-
79
-
80
-
81
-
82
-
83
-
84
-
 85
85 -
 86
86 -
 87
87 -
 88
88 -
 89
89 -
 90
90 -
 91
91 -
 92
92 -
 93
93 -
 94
94 -
 95
95 -
 96
96 -
 97
97 -
 98
98 -
 99
99 -
 100
100 -
 101
101 -
 102
102 -
 103
103 -
 104
104 -
 105
105 -
106
-
107
-
108
-
109
-
110
-
111
-
112
-
113
-
114
-
115
-
116
-
117
-
118
-
119
-
120
-
121
-
122
-
123
-
124
-
125
-
126
-
127
-
128
-
129
-
130
-
131
-
132
-
133
-
134
-
135
-
136
-
137
-
138
-
139
-
140
-
141
-
142
-
143
-
144
-
145
-
146
-
147
-
148
-
149
-
150
-
151
-
152
-
153
-
154
-
155
-
156
-
157
-
158
-
159
-
160
-
161
-
162
-
163
-
164
-
165
-
166
-
167
-
168
-
169
-
170
-
171
-
172
-
173
-
174
-
175
-
176
-
177
-
178
-
179
-
180
-
181
-
182
-
183
-
184
-
185
-
186
-
187
-
188
-
189
-
190
-
191
-
192
-
193
-
194
-
195
-
196
-
197
-
198
-
199
 |
 |

72
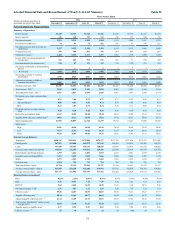
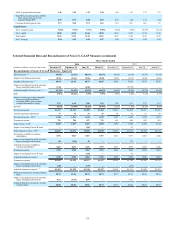
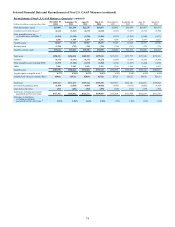
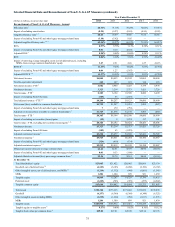
Selected Financial Data and Reconcilement of Non-U.S. GAAP Measures Table 34
Three Months Ended
(Dollars in millions and shares in
thousands, except per share data)
2014 2013
December 31 September 30 June 30 March 31 December 31 September 30 June 30 March 31
Selected Quarterly Financial Data
Summary of Operations:
Interest income $1,349 $1,353 $1,346 $1,336 $1,343 $1,339 $1,347 $1,359
Interest expense 138 138 137 132 130 131 136 138
Net interest income 1,211 1,215 1,209 1,204 1,213 1,208 1,211 1,221
Provision for credit losses 74 93 73 102 101 95 146 212
Net interest income after provision for
credit losses 1,137 1,122 1,136 1,102 1,112 1,113 1,065 1,009
Noninterest income 795 780 957 791 814 680 858 863
Noninterest expense 11,410 1,259 1,517 1,357 1,361 1,730 1,388 1,352
Income before provision/(benefit) for
income taxes 522 643 576 536 565 63 535 520
Provision/(benefit) for income taxes 1128 67 173 125 138 (133) 155 162
Net income attributable to noncontrolling
interest — — 4 6 1 7 3 6
Net income $394 $576 $399 $405 $426 $189 $377 $352
Net income available to common
shareholders $378 $563 $387 $393 $413 $179 $365 $340
Adjusted net income available to
common shareholders 2 $466 $433 $436 $393 $413 $358 $365 $340
Net interest income - FTE 3$1,248 $1,251 $1,244 $1,239 $1,247 $1,240 $1,242 $1,251
Total revenue - FTE 32,043 2,031 2,201 2,030 2,061 1,920 2,100 2,114
Total adjusted revenue - FTE 2, 3 2,043 2,031 2,096 2,030 2,061 1,983 2,100 2,114
Net income per average common share:
Diluted 0.72 1.06 0.72 0.73 0.77 0.33 0.68 0.63
Adjusted diluted 20.88 0.81 0.81 0.73 0.77 0.66 0.68 0.63
Basic 0.72 1.07 0.73 0.74 0.78 0.33 0.68 0.64
Dividends paid per average common
share 0.20 0.20 0.20 0.10 0.10 0.10 0.10 0.05
Book value per common share 41.52 40.85 40.18 39.44 38.61 37.85 37.65 37.89
Tangible book value per common share 429.82 29.21 28.64 27.82 27.01 26.27 26.08 26.33
Market capitalization 21,978 20,055 21,344 21,279 19,734 17,427 17,005 15,563
Market price:
High 43.06 40.86 40.84 41.26 36.99 36.29 32.84 29.98
Low 33.97 36.42 36.82 36.23 31.97 31.59 26.97 26.93
Close 41.90 38.03 40.06 39.79 36.81 32.42 31.57 28.81
Selected Average Balances:
Total assets $188,341 $183,433 $179,820 $176,971 $173,791 $171,838 $172,537 $171,808
Earning assets 167,227 163,688 160,373 157,343 154,567 154,235 153,495 152,471
Loans 133,438 130,747 130,734 128,525 125,649 122,672 121,372 120,882
Consumer and commercial deposits 136,892 132,195 130,472 128,396 127,460 126,618 126,579 127,655
Brokered time and foreign deposits 1,399 1,624 1,893 2,013 2,010 2,007 2,075 2,170
Intangible assets including MSRs 7,623 7,615 7,614 7,666 7,658 7,643 7,455 7,379
MSRs 1,272 1,262 1,220 1,265 1,253 1,232 1,039 957
Preferred stock 1,024 725 725 725 725 725 725 725
Total shareholders’ equity 22,754 22,191 21,994 21,727 21,251 21,027 21,272 21,117
Average common shares - diluted 527,959 533,230 535,486 536,992 537,921 538,850 539,763 539,862
Average common shares - basic 521,775 527,402 529,764 531,162 532,492 533,829 535,172 535,680
Financial Ratios (Annualized):
ROA 0.83% 1.25% 0.89% 0.93% 0.97% 0.44% 0.88% 0.83%
ROE 6.91 10.41 7.29 7.59 7.99 3.49 7.12 6.77
ROTCE 5 9.62 14.59 10.29 10.78 11.61 5.10 10.35 9.88
Net interest margin - FTE 32.96 3.03 3.11 3.19 3.20 3.19 3.25 3.33
Efficiency ratio 1, 669.00 62.03 68.93 66.83 66.05 90.13 66.07 63.97
Tangible efficiency ratio 1, 768.44 61.69 68.77 66.65 65.84 89.82 65.78 63.68
Adjusted tangible efficiency ratio 1, 2, 7 61.34 61.69 63.69 66.65 65.84 65.84 65.78 63.68
Total average shareholders’ equity to total
average assets 12.08 12.10 12.23 12.28 12.23 12.24 12.33 12.29
Tangible equity to tangible assets 89.17 8.94 9.07 9.01 9.00 8.98 8.95 9.00
Effective tax rate 1, 9 25 10 30 23 24 NM 29 31