SunTrust 2014 Annual Report Download - page 88
Download and view the complete annual report
Please find page 88 of the 2014 SunTrust annual report below. You can navigate through the pages in the report by either clicking on the pages listed below, or by using the keyword search tool below to find specific information within the annual report.-
 1
1 -
2
-
3
-
4
-
5
-
6
-
7
-
8
-
9
-
10
-
11
-
12
-
13
-
14
-
15
-
16
-
17
-
18
-
19
-
20
-
21
-
22
-
23
-
24
-
25
-
26
-
27
-
28
-
29
-
30
-
31
-
32
-
33
-
34
-
35
-
36
-
37
-
38
-
39
-
40
-
41
-
42
-
43
-
44
-
45
-
46
-
47
-
48
-
49
-
50
-
51
-
52
-
53
-
54
-
55
-
56
-
57
-
58
-
59
-
60
-
61
-
62
-
63
-
64
-
65
-
66
-
67
-
68
-
69
-
70
-
71
-
72
-
73
-
74
-
75
-
76
-
77
-
 78
78 -
 79
79 -
 80
80 -
 81
81 -
 82
82 -
 83
83 -
 84
84 -
 85
85 -
 86
86 -
 87
87 -
 88
88 -
 89
89 -
 90
90 -
 91
91 -
 92
92 -
 93
93 -
 94
94 -
 95
95 -
 96
96 -
 97
97 -
 98
98 -
99
-
100
-
101
-
102
-
103
-
104
-
105
-
106
-
107
-
108
-
109
-
110
-
111
-
112
-
113
-
114
-
115
-
116
-
117
-
118
-
119
-
120
-
121
-
122
-
123
-
124
-
125
-
126
-
127
-
128
-
129
-
130
-
131
-
132
-
133
-
134
-
135
-
136
-
137
-
138
-
139
-
140
-
141
-
142
-
143
-
144
-
145
-
146
-
147
-
148
-
149
-
150
-
151
-
152
-
153
-
154
-
155
-
156
-
157
-
158
-
159
-
160
-
161
-
162
-
163
-
164
-
165
-
166
-
167
-
168
-
169
-
170
-
171
-
172
-
173
-
174
-
175
-
176
-
177
-
178
-
179
-
180
-
181
-
182
-
183
-
184
-
185
-
186
-
187
-
188
-
189
-
190
-
191
-
192
-
193
-
194
-
195
-
196
-
197
-
198
-
199
 |
 |
65
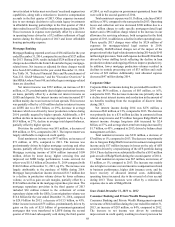
Parent Company Liquidity. Our primary measure of Parent
Company liquidity is the length of time the Parent Company can
meet its existing and certain forecasted obligations using its cash
resources. We measure and manage this metric, "Months to
Required Funding," using forecasts of both normal and adverse
conditions. Under adverse conditions, we measure how long the
Parent Company can meet its capital and debt service obligations
after experiencing material attrition of short-term, unsecured
funding and without the support of dividends from the Bank or
access to the capital markets. At December 31, 2014, the Parent's
Months to Required Funding remained well in excess of current
ALCO and Board limits. The BRC regularly reviews this and
other liquidity risk metrics. In accordance with these risk limits
established by ALCO and the Board, we manage the Parent
Company’s liquidity by structuring its net maturity schedule to
minimize the amount of debt maturing within a short period of
time. No Parent Company debt matured during 2014 and no
material Parent Company debt is scheduled to mature in 2015.
A majority of the Parent Company’s liabilities are long-term in
nature, coming from the proceeds of issuances of our capital
securities and long-term senior and subordinated notes.
We manage the Parent Company to maintain most of its
liquid assets in cash and securities that it could quickly convert
to cash. Unlike the Bank, it is not typical for the Parent Company
to maintain a material investment portfolio of publicly traded
securities. We manage the Parent Company cash balance to
provide sufficient liquidity to fund all forecasted obligations
(primarily debt and capital service) for an extended period of
months in accordance with our risk limits.
The primary uses of Parent Company liquidity include debt
service, dividends on capital instruments, the periodic purchase
of investment securities, loans to our subsidiaries, and common
share repurchases. See further details of the authorized common
share repurchases in the "Capital Resources" section of this
MD&A and in Item 5, "Market for Registrant's Common Equity,
Related Stockholder Matters, and Issuer Purchases of Equity
Securities" in this Form 10-K. We fund corporate dividends with
Parent Company cash, the primary sources of which are
dividends from our banking subsidiary and proceeds from the
issuance of debt and capital securities. We are subject to both
state and federal banking regulations that limit our ability to pay
common stock dividends in certain circumstances.
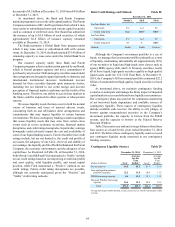
Other Liquidity Considerations. At December 31, 2014, our
liability for UTBs was $210 million and the liability for interest
related to these UTBs was $20 million. The UTBs represent the
difference between tax positions taken or expected to be taken
in our tax returns and the benefits recognized and measured in
accordance with the relevant accounting guidance for income
taxes. The UTBs are based on various tax positions in several
jurisdictions, and if taxes related to these positions are ultimately
paid, the payments would be made from our normal operating
cash flows, likely over multiple years. See additional discussion
in Note 14, "Income Taxes," to the Consolidated Financial
Statements in this Form 10-K.
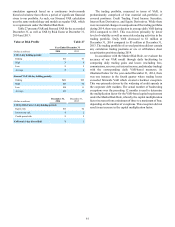
As presented in Table 30, we had an aggregate potential
obligation of $74.2 billion to our clients in unused lines of credit
at December 31, 2014. Commitments to extend credit are
arrangements to lend to clients who have complied with
predetermined contractual obligations. We also had $3.1 billion
in letters of credit at December 31, 2014, most of which are
standby letters of credit, which require that we provide funding
if certain future events occur. Approximately $1.1 billion of these
letters supported variable rate demand obligations at
December 31, 2014. Unused commercial lines of credit have
increased since December 31, 2013, as we continued to provide
credit availability to our clients.
Unfunded Lending Commitments Table 30
(Dollars in millions) December 31,
2014 December 31,
2013
Unused lines of credit:
Commercial $50,122 $43,444
Mortgage commitments 13,259 2,722
Home equity lines 10,858 11,157
CRE 3,302 2,078
Credit card 6,675 4,708
Total unused lines of credit $74,216 $64,109
Letters of credit:
Financial standby $2,917 $3,256
Performance standby 121 57
Commercial 32 28
Total letters of credit $3,070 $3,341
1 Includes IRLC contracts with notional balances of $2.3 billion and $1.8 billion at December
31, 2014 and 2013, respectively.
Other Market Risk
Other sources of market risk include the risk associated with
holding residential and commercial mortgage loans, and other
loans designated for sale, prior to selling them into the secondary
market, commitments to clients to make mortgage loans that will
be sold to the secondary market, and our investment in MSRs.
We manage the risks associated with the residential mortgage
LHFS (i.e., the warehouse) and our IRLCs on residential loans
intended for sale. The warehouses and IRLCs consist primarily
of fixed and adjustable rate single family residential loans. The
risk associated with the warehouses and IRLCs is the potential
change in interest rates between the time the customer locks the
rate on the anticipated loan and the time the loan is sold on the
secondary market, which is typically 60-150 days.
We manage interest rate risk predominantly with interest
rate swaps, futures, and forward sale agreements, where the
changes in value of the instruments substantially offset the
changes in value of the warehouse and the IRLCs. The IRLCs
on residential mortgage loans intended for sale are classified as
derivative financial instruments and are not designated as hedge
accounting relationships.
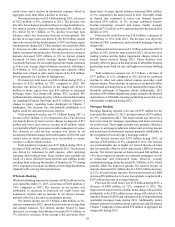
MSRs are the present value of future net cash flows that are
expected to be received from the mortgage servicing portfolio.
The value of MSRs is highly dependent upon the assumed
prepayment speed of the mortgage servicing portfolio, which is
driven by the level of certain key interest rates, primarily the 30-
year current coupon par mortgage rate. Future expected net cash
flows from servicing a loan in the mortgage servicing portfolio
would not be realized if the loan pays off earlier than anticipated.
MSRs are carried at fair value, with a balance of $1.2 billion
and $1.3 billion at December 31, 2014 and 2013, respectively.
They are managed within established risk limits and are