SunTrust 2014 Annual Report Download - page 65
Download and view the complete annual report
Please find page 65 of the 2014 SunTrust annual report below. You can navigate through the pages in the report by either clicking on the pages listed below, or by using the keyword search tool below to find specific information within the annual report.-
 1
1 -
2
-
3
-
4
-
5
-
6
-
7
-
8
-
9
-
10
-
11
-
12
-
13
-
14
-
15
-
16
-
17
-
18
-
19
-
20
-
21
-
22
-
23
-
24
-
25
-
26
-
27
-
28
-
29
-
30
-
31
-
32
-
33
-
34
-
35
-
36
-
37
-
38
-
39
-
40
-
41
-
42
-
43
-
44
-
45
-
46
-
47
-
48
-
49
-
50
-
51
-
52
-
53
-
54
-
 55
55 -
 56
56 -
 57
57 -
 58
58 -
 59
59 -
 60
60 -
 61
61 -
 62
62 -
 63
63 -
 64
64 -
 65
65 -
 66
66 -
 67
67 -
 68
68 -
 69
69 -
 70
70 -
 71
71 -
 72
72 -
 73
73 -
 74
74 -
 75
75 -
76
-
77
-
78
-
79
-
80
-
81
-
82
-
83
-
84
-
85
-
86
-
87
-
88
-
89
-
90
-
91
-
92
-
93
-
94
-
95
-
96
-
97
-
98
-
99
-
100
-
101
-
102
-
103
-
104
-
105
-
106
-
107
-
108
-
109
-
110
-
111
-
112
-
113
-
114
-
115
-
116
-
117
-
118
-
119
-
120
-
121
-
122
-
123
-
124
-
125
-
126
-
127
-
128
-
129
-
130
-
131
-
132
-
133
-
134
-
135
-
136
-
137
-
138
-
139
-
140
-
141
-
142
-
143
-
144
-
145
-
146
-
147
-
148
-
149
-
150
-
151
-
152
-
153
-
154
-
155
-
156
-
157
-
158
-
159
-
160
-
161
-
162
-
163
-
164
-
165
-
166
-
167
-
168
-
169
-
170
-
171
-
172
-
173
-
174
-
175
-
176
-
177
-
178
-
179
-
180
-
181
-
182
-
183
-
184
-
185
-
186
-
187
-
188
-
189
-
190
-
191
-
192
-
193
-
194
-
195
-
196
-
197
-
198
-
199
 |
 |
42
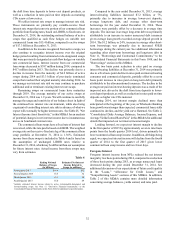
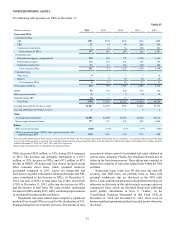
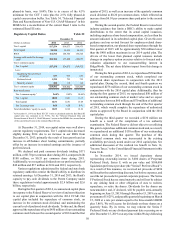
Nonperforming Loans
Nonperforming commercial loans decreased $74 million, or
30%, from December 31, 2013 to $173 million at December 31,
2014.
Residential NPLs were the largest driver of the overall
decrease in NPLs, down $257 million, or 36%, from
December 31, 2013 to $455 million at December 31, 2014. The
decrease was primarily driven by the normal net charge-off and
foreclosure process, lower levels of new NPLs, and the
aforementioned NPL sale.
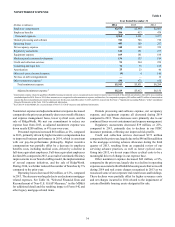
Interest income on consumer and residential nonaccrual
loans, if recognized, is recognized on a cash basis. Interest
income on commercial nonaccrual loans is not generally
recognized until after the principal amount has been reduced to
zero. We recognized $22 million and $33 million of interest
income related to nonaccrual loans during 2014 and 2013,
respectively. If all such loans had been accruing interest
according to their original contractual terms, estimated interest
income of $47 million and $73 million would have been
recognized in 2014 and 2013, respectively.
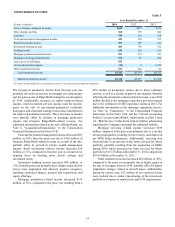
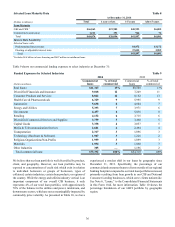
Other Nonperforming Assets
OREO decreased $71 million, or 42%, during 2014 compared
to 2013 as a result of net decreases of $42 million in residential
homes, $16 million in commercial properties, and $13 million
in residential construction related properties. Sales of OREO
resulted in proceeds of $235 million and $356 million during
2014 and 2013, respectively, contributing to net gains on sales
of OREO of $42 million and $69 million, respectively, inclusive
of valuation reserves.
Gains and losses on the sale of OREO are recorded in other
noninterest expense in the Consolidated Statements of Income.
Sales of OREO and the related gains or losses are highly
dependent on our disposition strategy and buyer opportunities.
See Note 18, “Fair Value Election and Measurement,” to the
Consolidated Financial Statements in this Form 10-K for
additional information.
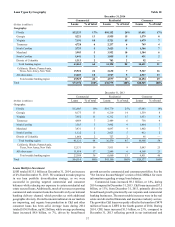
Geographically, most of our OREO properties are located
in Florida, Georgia, and North Carolina. Residential and
commercial properties comprised 76% and 17%, respectively,
of OREO at December 31, 2014; the remainder is related to land
and other properties. Upon foreclosure, the values of these
properties were reevaluated and, if necessary, written down to
their then-current estimated value less estimated costs to sell.
Any further decreases in values could result in additional losses
on these properties as we periodically revalue them as further
discussed in Note 18, "Fair Value Election and Measurement,"
to the Consolidated Financial Statements in this Form 10-K. We
are actively managing and disposing of these foreclosed assets
to minimize future losses.
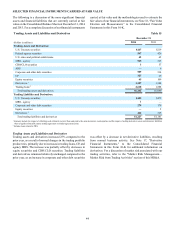
Accruing loans past due 90 days or more included LHFI and
LHFS and totaled $1.1 billion and $1.2 billion, at December 31,
2014 and 2013, respectively. Of these, 97% and 96% were
government-guaranteed at December 31, 2014 and 2013,
respectively. Accruing LHFI past due 90 days or more decreased
by $171 million, or 14%, during 2014, primarily driven by a
reduction in residential mortgages that are guaranteed by a
federal agency.
Restructured Loans
To maximize the collection of loan balances, we evaluate
troubled loans on a case-by-case basis to determine if a loan
modification would be appropriate. We pursue loan
modifications when there is a reasonable chance that an
appropriate modification would allow our client to continue
servicing the debt. For loans secured by residential real estate,
if the client demonstrates a loss of income such that the client
cannot reasonably support a modified loan, we may pursue short
sales and/or deed-in-lieu arrangements. For loans secured by
income producing commercial properties, we perform an in-
depth and ongoing programmatic review. We review a number
of factors, including cash flows, loan structures, collateral
values, and guarantees to identify loans within our income
producing commercial loan portfolio that are most likely to
experience distress. Based on our review of these factors and our
assessment of overall risk, we evaluate the benefits of proactively
initiating discussions with our clients to improve a loan’s risk
profile. In some cases, we may renegotiate terms of their loans
so that they have a higher likelihood of continuing to perform.
To date, we have restructured loans in a variety of ways to help
our clients service their debt and to mitigate the potential for
additional losses. The primary restructuring methods being
offered to our residential clients are reductions in interest rates
and extensions of terms. For commercial loans, the primary
restructuring method is the extension of terms.
Loans with modifications deemed to be economic
concessions resulting from borrower financial difficulties are
reported as TDRs. Accruing loans may retain accruing status at
the time of restructure and the status is determined by, among
other things, the nature of the restructure, the borrower's
repayment history, and the borrower's repayment capacity.
Nonaccruing loans that are modified and demonstrate a
sustainable history of repayment performance, typically six
months, in accordance with their modified terms are generally
reclassified to accruing TDR status. Generally, once a residential
loan becomes a TDR, we expect that the loan will continue to
be reported as a TDR for its remaining life even after returning
to accruing status unless the modified rates and terms at the time
of modification were available in the market at the time of the
modification, or if the loan is subsequently remodified at market
rates. We note that some restructurings may not ultimately result
in the complete collection of principal and interest (as modified
by the terms of the restructuring), culminating in default, which
could result in additional incremental losses. These potential
incremental losses have been factored into our ALLL estimate.
The level of re-defaults will likely be affected by future economic
conditions. See Note 6, "Loans," to the Consolidated Financial
Statements in this Form 10-K for more information.
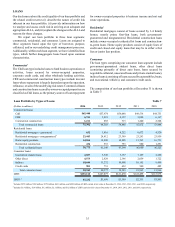
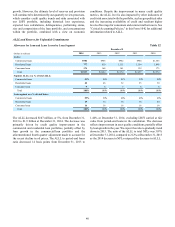
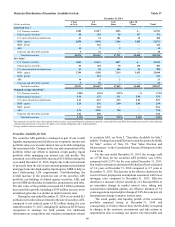
Table 14 displays our residential real estate TDR portfolio
by modification type and payment status. Guaranteed loans that
have been repurchased from Ginnie Mae under an early buyout
clause and subsequently modified have been excluded from the
table. Such loans totaled approximately $49 million and $54
million at December 31, 2014 and 2013, respectively.