SunTrust 2014 Annual Report Download - page 7
Download and view the complete annual report
Please find page 7 of the 2014 SunTrust annual report below. You can navigate through the pages in the report by either clicking on the pages listed below, or by using the keyword search tool below to find specific information within the annual report.-
 1
1 -
 2
2 -
 3
3 -
 4
4 -
 5
5 -
 6
6 -
 7
7 -
 8
8 -
 9
9 -
 10
10 -
 11
11 -
 12
12 -
 13
13 -
 14
14 -
 15
15 -
 16
16 -
 17
17 -
 18
18 -
19
-
20
-
21
-
22
-
23
-
24
-
25
-
26
-
27
-
28
-
29
-
30
-
31
-
32
-
33
-
34
-
35
-
36
-
37
-
38
-
39
-
40
-
41
-
42
-
43
-
44
-
45
-
46
-
47
-
48
-
49
-
50
-
51
-
52
-
53
-
54
-
55
-
56
-
57
-
58
-
59
-
60
-
61
-
62
-
63
-
64
-
65
-
66
-
67
-
68
-
69
-
70
-
71
-
72
-
73
-
74
-
75
-
76
-
77
-
78
-
79
-
80
-
81
-
82
-
83
-
84
-
85
-
86
-
87
-
88
-
89
-
90
-
91
-
92
-
93
-
94
-
95
-
96
-
97
-
98
-
99
-
100
-
101
-
102
-
103
-
104
-
105
-
106
-
107
-
108
-
109
-
110
-
111
-
112
-
113
-
114
-
115
-
116
-
117
-
118
-
119
-
120
-
121
-
122
-
123
-
124
-
125
-
126
-
127
-
128
-
129
-
130
-
131
-
132
-
133
-
134
-
135
-
136
-
137
-
138
-
139
-
140
-
141
-
142
-
143
-
144
-
145
-
146
-
147
-
148
-
149
-
150
-
151
-
152
-
153
-
154
-
155
-
156
-
157
-
158
-
159
-
160
-
161
-
162
-
163
-
164
-
165
-
166
-
167
-
168
-
169
-
170
-
171
-
172
-
173
-
174
-
175
-
176
-
177
-
178
-
179
-
180
-
181
-
182
-
183
-
184
-
185
-
186
-
187
-
188
-
189
-
190
-
191
-
192
-
193
-
194
-
195
-
196
-
197
-
198
-
199
 |
 |

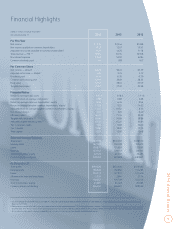
Financial Highlights
(Dollars in millions, except per share data)
Year ended December 31 2014 2013 2012
For The Year
Net income $1,774 $1,344 $1,958
Net income available to common shareholders 1,722 1,297 1,931
Adjusted net income available to common shareholders1 1,729 1,476 1,178
Total revenue — FTE 1, 2 8,305 8,194 10,598
Noninterest expense 5,543 5,831 6,284
Common dividends paid 371 188 107
Per Common Share
Net income — diluted $3.23 $2.41 $3.59
Adjusted net income — diluted 1 3.24 2.74 2.19
Dividends paid 0.70 0.35 0.20
Common stock closing price 41.90 36.81 28.35
Book value 41.52 38.61 37.59
Tangible book value 1 29.82 27.01 25.98
Financial Ratios
Return on average total assets 0.97% 0.78 % 1.1 1 %
Adjusted return on average total assets 1 0.98 0.88 0.68
Return on average common shareholders’ equity 8.06 6.34 9.56
Return on average tangible common shareholders’ equity 1 11.33 9.25 14.02
Adjusted return on average tangible common shareholders’ equity 1 11.37 10.52 8.55
Net interest margin 2 3.07 3.24 3.40
Efficiency ratio 2 66.74 71.16 59.29
Tangible efficiency ratio 1,2 66.44 70.89 58.86
Adjusted tangible efficiency ratio 1,2 63.34 65.27 66.91
Tier 1 common equity 9.60 9.82 10.04
Tier 1 capital 10.80 10.81 11.13
Total capital 12.51 12.81 13.48
Selected Average Balances
Total assets $182,176 $172 , 4 9 7 $176,1 34
Earning assets 162,189 153,728 153,479
Loans 130,874 122,657 122,893
Deposits 133,742 129,141 128,504
Total shareholders’ equity 22,170 21,167 20,495
Common shares — diluted 533,391 539,093 538,061
At December 31
Total assets $190,328 $175,335 $173,442
Earning assets 168,678 156,856 151,223
Loans 133,112 127,877 121,470
Allowance for loan and lease losses 1,937 2,044 2,174
Deposits 140,567 129,759 132,316
Total shareholders’ equity 23,005 21,422 20,985
Common shares outstanding 524,540 536,097 538,959
1 See reconciliation of non-GAAP measures in Table 34, “Selected Financial Data and Reconcilement of Non-U.S. GAAP Measures,” in the MD&A section of the Company’s 2014 Annual
Report on Form 10-K.
2 Total revenue is comprised of net interest income presented on a fully taxable-equivalent (FTE) basis and noninterest income. The net interest margin and efficiency ratios are presented
on a FTE basis. The FTE basis adjusts for the tax-favored status of income from certain loans and investments. The Company believes this measure to be the preferred industry measurement
of net interest income and it enhances comparability of net interest income arising from taxable and tax-exempt sources.
2014 Annual Report
5