SunTrust 2014 Annual Report Download - page 177
Download and view the complete annual report
Please find page 177 of the 2014 SunTrust annual report below. You can navigate through the pages in the report by either clicking on the pages listed below, or by using the keyword search tool below to find specific information within the annual report.-
 1
1 -
2
-
3
-
4
-
5
-
6
-
7
-
8
-
9
-
10
-
11
-
12
-
13
-
14
-
15
-
16
-
17
-
18
-
19
-
20
-
21
-
22
-
23
-
24
-
25
-
26
-
27
-
28
-
29
-
30
-
31
-
32
-
33
-
34
-
35
-
36
-
37
-
38
-
39
-
40
-
41
-
42
-
43
-
44
-
45
-
46
-
47
-
48
-
49
-
50
-
51
-
52
-
53
-
54
-
55
-
56
-
57
-
58
-
59
-
60
-
61
-
62
-
63
-
64
-
65
-
66
-
67
-
68
-
69
-
70
-
71
-
72
-
73
-
74
-
75
-
76
-
77
-
78
-
79
-
80
-
81
-
82
-
83
-
84
-
85
-
86
-
87
-
88
-
89
-
90
-
91
-
92
-
93
-
94
-
95
-
96
-
97
-
98
-
99
-
100
-
101
-
102
-
103
-
104
-
105
-
106
-
107
-
108
-
109
-
110
-
111
-
112
-
113
-
114
-
115
-
116
-
117
-
118
-
119
-
120
-
121
-
122
-
123
-
124
-
125
-
126
-
127
-
128
-
129
-
130
-
131
-
132
-
133
-
134
-
135
-
136
-
137
-
138
-
139
-
140
-
141
-
142
-
143
-
144
-
145
-
146
-
147
-
148
-
149
-
150
-
151
-
152
-
153
-
154
-
155
-
156
-
157
-
158
-
159
-
160
-
161
-
162
-
163
-
164
-
165
-
166
-
 167
167 -
 168
168 -
 169
169 -
 170
170 -
 171
171 -
 172
172 -
 173
173 -
 174
174 -
 175
175 -
 176
176 -
 177
177 -
 178
178 -
 179
179 -
 180
180 -
 181
181 -
 182
182 -
 183
183 -
 184
184 -
 185
185 -
 186
186 -
 187
187 -
188
-
189
-
190
-
191
-
192
-
193
-
194
-
195
-
196
-
197
-
198
-
199
 |
 |
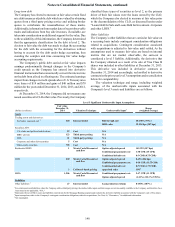
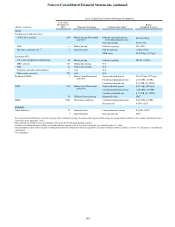
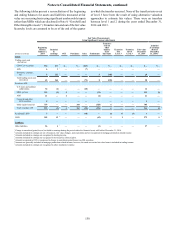
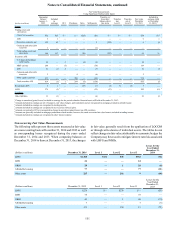
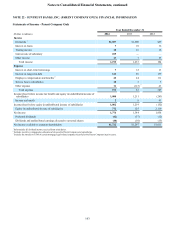
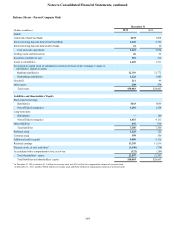
Notes to Consolidated Financial Statements, continued
154
estimated fair value can vary significantly depending on a
market participant’s ultimate considerations and
assumptions. The final value yields a market participant’s
expected return on investment that is indicative of the
current market conditions, but it does not take into
consideration the Company’s estimated value from
continuing to hold these loans or its lack of willingness to
transact at these estimated values.
The Company generally estimated fair value for LHFI
based on estimated future cash flows discounted, initially,
at current origination rates for loans with similar terms and
credit quality, which derived an estimated value of 100%
and 99% on the loan portfolio’s net carrying value at
December 31, 2014 and 2013, respectively. The value
derived from origination rates likely does not represent an
exit price; therefore, an incremental market risk and
liquidity discount was subtracted from the initial value at
December 31, 2014 and 2013. The discounted value is a
function of a market participant’s required yield in the
current environment and is not a reflection of the expected
cumulative losses on the loans. Loan prepayments are used
to adjust future cash flows based on historical experience
and prepayment model forecasts. The value of related
accrued interest on loans approximates fair value; however,
it is not included in the carrying amount or fair value of
loans. The value of long-term customer relationships is not
permitted under current U.S. GAAP to be included in the
estimated fair value.
(e) Deposit liabilities with no defined maturity such as DDAs,
NOW/money market accounts, and savings accounts have
a fair value equal to the amount payable on demand at the
reporting date (i.e., their carrying amounts). Fair values for
CDs are estimated using a discounted cash flow
measurement that applies current interest rates to a schedule
of aggregated expected maturities. The assumptions used
in the discounted cash flow analysis are expected to
approximate those that market participants would use in
valuing deposits. The value of long-term relationships with
depositors is not taken into account in estimating fair values.
For valuation of brokered time deposits that the Company
measures at fair value as well as those that are carried at
amortized cost, refer to the respective valuation section
within this footnote.
(f) Fair values for short-term borrowings and certain long-term
debt are based on quoted market prices for similar
instruments or estimated using discounted cash flow
analysis and the Company’s current incremental borrowing
rates for similar types of instruments. For long-term debt
that the Company measures at fair value, refer to the
respective valuation section within this footnote. For level
3 debt, the terms are unique in nature or there are otherwise
no similar instruments that can be used to value the
instrument without using significant unobservable
assumptions. In this situation, the Company reviews
current borrowing rates along with the collateral levels that
secure the debt in determining an appropriate fair value
adjustment.
Unfunded loan commitments and letters of credit are not
included in the table above. At December 31, 2014 and 2013,
the Company had $56.5 billion and $48.9 billion, respectively,
of unfunded commercial loan commitments and letters of credit.
A reasonable estimate of the fair value of these instruments is
the carrying value of deferred fees plus the related unfunded
commitments reserve, which was a combined $59 million and
$53 million at December 31, 2014 and 2013, respectively. No
active trading market exists for these instruments, and the
estimated fair value does not include any value associated with
the borrower relationship. The Company does not estimate the
fair values of consumer unfunded lending commitments which
can generally be canceled by providing notice to the borrower.
NOTE 19 – CONTINGENCIES
Litigation and Regulatory Matters
In the ordinary course of business, the Company and its
subsidiaries are parties to numerous civil claims and lawsuits
and subject to regulatory examinations, investigations, and
requests for information. Some of these matters involve claims
for substantial amounts. The Company’s experience has shown
that the damages alleged by plaintiffs or claimants are often
overstated, based on unsubstantiated legal theories, unsupported
by facts, and/or bear no relation to the ultimate award that a court
might grant. Additionally, the outcome of litigation and
regulatory matters and the timing of ultimate resolution are
inherently difficult to predict. These factors make it difficult for
the Company to provide a meaningful estimate of the range of
reasonably possible outcomes of claims in the aggregate or by
individual claim. However, on a case-by-case basis, reserves are
established for those legal claims in which it is probable that a
loss will be incurred and the amount of such loss can be
reasonably estimated. The actual costs of resolving these claims
may be substantially higher or lower than the amounts reserved.
For a limited number of legal matters in which the Company
is involved, the Company is able to estimate a range of reasonably
possible losses. For other matters for which a loss is probable or
reasonably possible, such an estimate is not possible. For those
matters where a loss is reasonably possible, management
currently estimates the aggregate range of reasonably possible
losses as $0 to approximately $180 million in excess of the
reserves, if any, related to those matters. This estimated range of
reasonably possible losses represents the estimated possible
losses over the life of such legal matters, which may span a
currently indeterminable number of years, and is based on
information available at December 31, 2014. The matters
underlying the estimated range will change from time to time,
and actual results may vary significantly from this estimate.
Those matters for which an estimate is not possible are not
included within this estimated range; therefore, this estimated
range does not represent the Company’s maximum loss
exposure. Based on current knowledge, it is the opinion of
management that liabilities arising from legal claims in excess