SunTrust 2014 Annual Report Download - page 188
Download and view the complete annual report
Please find page 188 of the 2014 SunTrust annual report below. You can navigate through the pages in the report by either clicking on the pages listed below, or by using the keyword search tool below to find specific information within the annual report.-
 1
1 -
2
-
3
-
4
-
5
-
6
-
7
-
8
-
9
-
10
-
11
-
12
-
13
-
14
-
15
-
16
-
17
-
18
-
19
-
20
-
21
-
22
-
23
-
24
-
25
-
26
-
27
-
28
-
29
-
30
-
31
-
32
-
33
-
34
-
35
-
36
-
37
-
38
-
39
-
40
-
41
-
42
-
43
-
44
-
45
-
46
-
47
-
48
-
49
-
50
-
51
-
52
-
53
-
54
-
55
-
56
-
57
-
58
-
59
-
60
-
61
-
62
-
63
-
64
-
65
-
66
-
67
-
68
-
69
-
70
-
71
-
72
-
73
-
74
-
75
-
76
-
77
-
78
-
79
-
80
-
81
-
82
-
83
-
84
-
85
-
86
-
87
-
88
-
89
-
90
-
91
-
92
-
93
-
94
-
95
-
96
-
97
-
98
-
99
-
100
-
101
-
102
-
103
-
104
-
105
-
106
-
107
-
108
-
109
-
110
-
111
-
112
-
113
-
114
-
115
-
116
-
117
-
118
-
119
-
120
-
121
-
122
-
123
-
124
-
125
-
126
-
127
-
128
-
129
-
130
-
131
-
132
-
133
-
134
-
135
-
136
-
137
-
138
-
139
-
140
-
141
-
142
-
143
-
144
-
145
-
146
-
147
-
148
-
149
-
150
-
151
-
152
-
153
-
154
-
155
-
156
-
157
-
158
-
159
-
160
-
161
-
162
-
163
-
164
-
165
-
166
-
167
-
168
-
169
-
170
-
171
-
172
-
173
-
174
-
175
-
176
-
177
-
 178
178 -
 179
179 -
 180
180 -
 181
181 -
 182
182 -
 183
183 -
 184
184 -
 185
185 -
 186
186 -
 187
187 -
 188
188 -
 189
189 -
 190
190 -
 191
191 -
 192
192 -
 193
193 -
 194
194 -
 195
195 -
 196
196 -
 197
197 -
 198
198 -
199
 |
 |

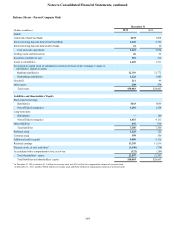
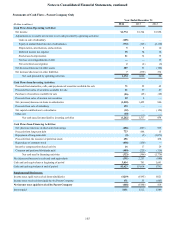
Notes to Consolidated Financial Statements, continued
165
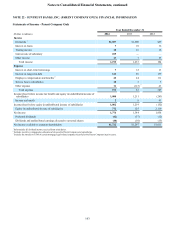
Statements of Cash Flows - Parent Company Only
Year Ended December 31
(Dollars in millions) 2014 2013 2012
Cash Flows from Operating Activities:
Net income $1,774 $1,344 $1,958
Adjustments to reconcile net income to net cash provided by operating activities:
Gain on sale of subsidiary (105) — —
Equity in undistributed income of subsidiaries (772) (125) (2,110)
Depreciation, amortization, and accretion 55 10
Deferred income tax expense 35 74 18
Stock-based compensation 21 34 35
Net loss on extinguishment of debt —— 15
Net securities losses/(gains) 2(2) (6)
Net decrease/(increase) in other assets 207 51 (188)
Net increase/(decrease) in other liabilities 7(339) 332
Net cash provided by operating activities 1,174 1,042 64
Cash Flows from Investing Activities:
Proceeds from maturities, calls, and paydowns of securities available for sale 71 55 65
Proceeds from sales of securities available for sale 21 57 47
Purchases of securities available for sale (26) (25) (68)
Proceeds from sales of auction rate securities 59 8 —
Net (increase)/decrease in loans to subsidiaries (1,518) 1,422 940
Proceeds from sale of subsidiary 193 — —
Net capital contributions to subsidiaries (32) — (150)
Other, net (10) — —
Net cash (used in)/provided by investing activities (1,242) 1,517 834
Cash Flows from Financing Activities:
Net (decrease)/increase in short-term borrowings (686) (827) 935
Proceeds from long-term debt 723 888 15
Repayment of long-term debt (5) (9) (3,073)
Proceeds from the issuance of preferred stock 496 — 438
Repurchase of common stock (458) (150) —
Incentive compensation related activity 16 17 26
Common and preferred dividends paid (409) (225) (119)
Net cash used in financing activities (323) (306) (1,778)
Net (decrease)/increase in cash and cash equivalents (391) 2,253 (880)
Cash and cash equivalents at beginning of period 3,014 761 1,641
Cash and cash equivalents at end of period $2,623 $3,014 $761
Supplemental Disclosures:
Income taxes (paid to)/received from subsidiaries ($219) ($195) $621
Income taxes received from/(paid by) by Parent Company 171 55 (605)
Net income taxes (paid)/received by Parent Company ($48) ($140) $16
Interest paid $131 $112 $189