SunTrust 2014 Annual Report Download - page 174
Download and view the complete annual report
Please find page 174 of the 2014 SunTrust annual report below. You can navigate through the pages in the report by either clicking on the pages listed below, or by using the keyword search tool below to find specific information within the annual report.-
 1
1 -
2
-
3
-
4
-
5
-
6
-
7
-
8
-
9
-
10
-
11
-
12
-
13
-
14
-
15
-
16
-
17
-
18
-
19
-
20
-
21
-
22
-
23
-
24
-
25
-
26
-
27
-
28
-
29
-
30
-
31
-
32
-
33
-
34
-
35
-
36
-
37
-
38
-
39
-
40
-
41
-
42
-
43
-
44
-
45
-
46
-
47
-
48
-
49
-
50
-
51
-
52
-
53
-
54
-
55
-
56
-
57
-
58
-
59
-
60
-
61
-
62
-
63
-
64
-
65
-
66
-
67
-
68
-
69
-
70
-
71
-
72
-
73
-
74
-
75
-
76
-
77
-
78
-
79
-
80
-
81
-
82
-
83
-
84
-
85
-
86
-
87
-
88
-
89
-
90
-
91
-
92
-
93
-
94
-
95
-
96
-
97
-
98
-
99
-
100
-
101
-
102
-
103
-
104
-
105
-
106
-
107
-
108
-
109
-
110
-
111
-
112
-
113
-
114
-
115
-
116
-
117
-
118
-
119
-
120
-
121
-
122
-
123
-
124
-
125
-
126
-
127
-
128
-
129
-
130
-
131
-
132
-
133
-
134
-
135
-
136
-
137
-
138
-
139
-
140
-
141
-
142
-
143
-
144
-
145
-
146
-
147
-
148
-
149
-
150
-
151
-
152
-
153
-
154
-
155
-
156
-
157
-
158
-
159
-
160
-
161
-
162
-
163
-
 164
164 -
 165
165 -
 166
166 -
 167
167 -
 168
168 -
 169
169 -
 170
170 -
 171
171 -
 172
172 -
 173
173 -
 174
174 -
 175
175 -
 176
176 -
 177
177 -
 178
178 -
 179
179 -
 180
180 -
 181
181 -
 182
182 -
 183
183 -
 184
184 -
185
-
186
-
187
-
188
-
189
-
190
-
191
-
192
-
193
-
194
-
195
-
196
-
197
-
198
-
199
 |
 |
Notes to Consolidated Financial Statements, continued
151
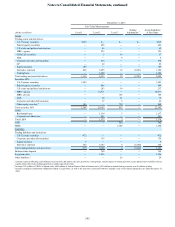
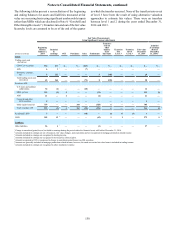
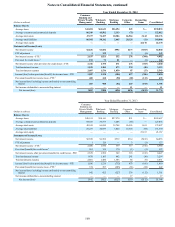
Fair Value Measurements
Using Significant Unobservable Inputs
(Dollars in millions)
Beginning
balance
January 1,
2013
Included
in
earnings OCI Purchases Sales Settlements
Transfers to/
from other
balance sheet
line items
Transfers
into
Level 3
Transfers
out of
Level 3
Fair value
December
31, 2013
Included in
earnings (held
at December
31, 2013) 1
Assets
Trading assets and
derivatives:
CDO/CLO securities $52 $23 3$— $— ($20) ($1) $— $— $— $54 $15 3
ABS 5 1 3— — — — — — — 6 1 3
Derivative contracts, net 132 93 2— — — 2 (222) — — 5 7(5)2
Corporate and other debt
securities 1 — — — — (1) — — — — —
Total trading assets and
derivatives 190 117 — — (20) — (222) — — 65 11
Securities AFS:
U.S. states and political
subdivisions 46 — 2 — (6) (8) — — — 34 —
MBS - private 209 — (5) — — (50) — — — 154 —
ABS 21 (1) 4 — — (3) — — — 21 (1)
Corporate and other debt
securities 5 — — 4 — (4) — — — 5 —
Other equity securities 633 — — 200 — (94) — — — 739 —
Total securities AFS 914 (1) 415204 (6) (159) — — — 953 (1)4
Residential LHFS 8 1 6— — (25) (1)(8) 32 (4) 3 —
LHFI 379 (5) 6— — — (55)(17) — — 302 (11)6
Liabilities
Other liabilities 31 (1) 7— — — (4) — — — 26 (1)7
1 Change in unrealized gains/(losses) included in earnings for the period related to financial assets still held at December 31, 2013.
2 Amounts included in earnings are net of issuances, fair value changes, and expirations and are recognized in mortgage production related income.
3 Amounts included in earnings are recognized in trading income.
4 Amounts included in earnings are recognized in net securities (losses)/gains.
5 Amounts recognized in OCI are recognized in change in unrealized gains/(losses) on AFS securities.
6 Amounts are generally included in mortgage production related income; however, the mark on certain fair value loans is included in trading income.
7 Amounts included in earnings are recognized in other interest expense.
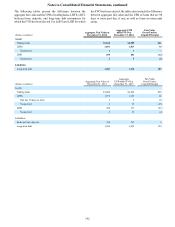
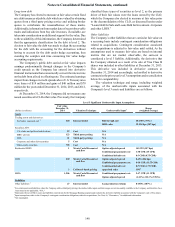
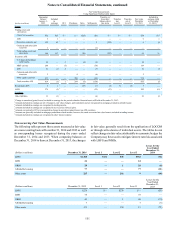
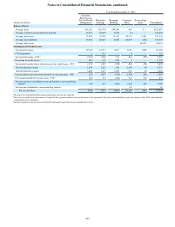
Non-recurring Fair Value Measurements
The following tables present those assets measured at fair value
on a non-recurring basis at December 31, 2014 and 2013 as well
as corresponding losses recognized during the years ended
December 31, 2014 and 2013. When comparing balances at
December 31, 2014 to those at December 31, 2013, the changes
in fair value generally result from the application of LOCOM
or through write-downs of individual assets. The tables do not
reflect changes in fair value attributable to economic hedges the
Company may have used to mitigate interest rate risk associated
with LHFS and MSRs.
(Dollars in millions) December 31, 2014 Level 1 Level 2 Level 3
Losses for the
Year Ended
December 31,
2014
LHFS $1,108 $121 $45 $942 ($6)
LHFI 24 — — 24 —
OREO 29 — 1 28 (6)
Affordable housing 77 — — 77 (21)
Other assets 225 — 216 9 (64)
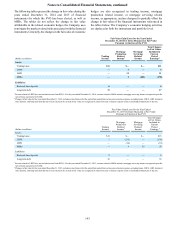
(Dollars in millions) December 31, 2013 Level 1 Level 2 Level 3
Losses for the
Year Ended
December 31,
2013
LHFS $278 $— $278 $— ($3)
LHFI 75 — — 75 —
OREO 49 — 1 48 (10)
Affordable housing 7 — — 7 (3)
Other assets 171 — 158 13 (61)