SunTrust 2014 Annual Report Download - page 68
Download and view the complete annual report
Please find page 68 of the 2014 SunTrust annual report below. You can navigate through the pages in the report by either clicking on the pages listed below, or by using the keyword search tool below to find specific information within the annual report.-
 1
1 -
2
-
3
-
4
-
5
-
6
-
7
-
8
-
9
-
10
-
11
-
12
-
13
-
14
-
15
-
16
-
17
-
18
-
19
-
20
-
21
-
22
-
23
-
24
-
25
-
26
-
27
-
28
-
29
-
30
-
31
-
32
-
33
-
34
-
35
-
36
-
37
-
38
-
39
-
40
-
41
-
42
-
43
-
44
-
45
-
46
-
47
-
48
-
49
-
50
-
51
-
52
-
53
-
54
-
55
-
56
-
57
-
 58
58 -
 59
59 -
 60
60 -
 61
61 -
 62
62 -
 63
63 -
 64
64 -
 65
65 -
 66
66 -
 67
67 -
 68
68 -
 69
69 -
 70
70 -
 71
71 -
 72
72 -
 73
73 -
 74
74 -
 75
75 -
 76
76 -
 77
77 -
 78
78 -
79
-
80
-
81
-
82
-
83
-
84
-
85
-
86
-
87
-
88
-
89
-
90
-
91
-
92
-
93
-
94
-
95
-
96
-
97
-
98
-
99
-
100
-
101
-
102
-
103
-
104
-
105
-
106
-
107
-
108
-
109
-
110
-
111
-
112
-
113
-
114
-
115
-
116
-
117
-
118
-
119
-
120
-
121
-
122
-
123
-
124
-
125
-
126
-
127
-
128
-
129
-
130
-
131
-
132
-
133
-
134
-
135
-
136
-
137
-
138
-
139
-
140
-
141
-
142
-
143
-
144
-
145
-
146
-
147
-
148
-
149
-
150
-
151
-
152
-
153
-
154
-
155
-
156
-
157
-
158
-
159
-
160
-
161
-
162
-
163
-
164
-
165
-
166
-
167
-
168
-
169
-
170
-
171
-
172
-
173
-
174
-
175
-
176
-
177
-
178
-
179
-
180
-
181
-
182
-
183
-
184
-
185
-
186
-
187
-
188
-
189
-
190
-
191
-
192
-
193
-
194
-
195
-
196
-
197
-
198
-
199
 |
 |
45
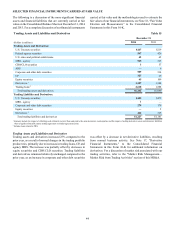
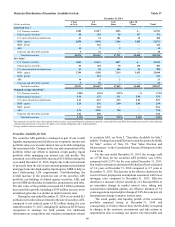
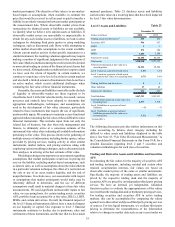
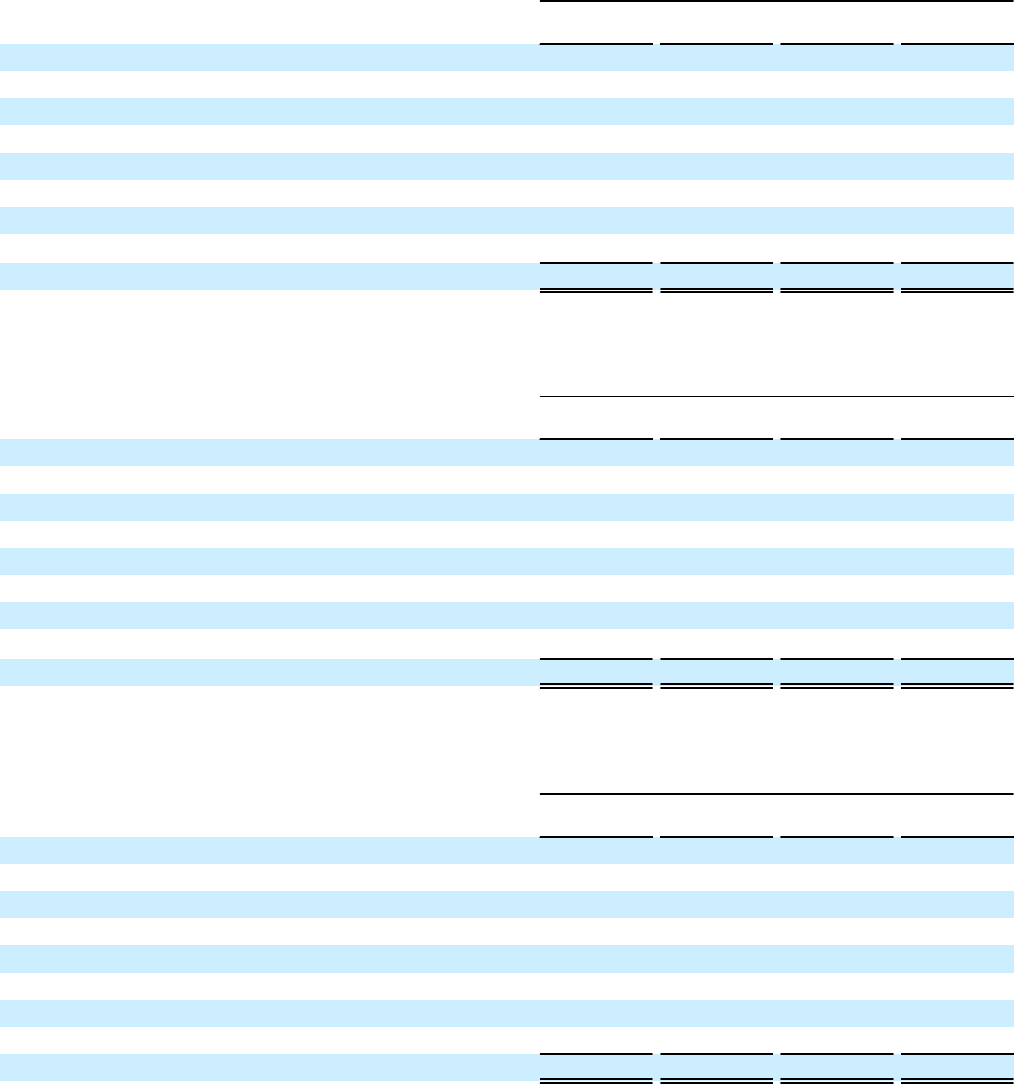
Securities Available for Sale Table 16
December 31, 2014
(Dollars in millions) Amortized
Cost Unrealized
Gains Unrealized
Losses Fair
Value
U.S. Treasury securities $1,913 $9 $1 $1,921
Federal agency securities 471 15 2 484
U.S. states and political subdivisions 200 9 — 209
MBS - agency 22,573 558 83 23,048
MBS - private 122 2 1 123
ABS 19 2 — 21
Corporate and other debt securities 38 3 — 41
Other equity securities1921 2 — 923
Total securities AFS $26,257 $600 $87 $26,770
1 At December 31, 2014, other equity securities was comprised of the following: $376 million in FHLB of Atlanta stock, $402 million in Federal Reserve Bank of Atlanta stock, $138 million
in mutual fund investments, and $7 million of other.
December 31, 2013
(Dollars in millions) Amortized
Cost Unrealized
Gains Unrealized
Losses Fair
Value
U.S. Treasury securities $1,334 $6 $47 $1,293
Federal agency securities 1,028 13 57 984
U.S. states and political subdivisions 232 7 2 237
MBS - agency 18,915 421 425 18,911
MBS - private 155 1 2 154
ABS 78 2 1 79
Corporate and other debt securities 39 3 — 42
Other equity securities1841 1 — 842
Total securities AFS $22,622 $454 $534 $22,542
1 At December 31, 2013, other equity securities was comprised of the following: $336 million in FHLB of Atlanta stock, $402 million in Federal Reserve Bank of Atlanta stock, $103 million
in mutual fund investments, and $1 million of other.
December 31, 2012
(Dollars in millions) Amortized
Cost Unrealized
Gains Unrealized
Losses Fair
Value
U.S. Treasury securities $212 $10 $— $222
Federal agency securities 1,987 85 3 2,069
U.S. states and political subdivisions 310 15 5 320
MBS - agency 17,416 756 3 18,169
MBS - private 205 4 — 209
ABS 214 5 3 216
Corporate and other debt securities 42 4 — 46
Other equity securities1701 1 — 702
Total securities AFS $21,087 $880 $14 $21,953
1 At December 31, 2012, other equity securities was comprised of the following: $229 million in FHLB of Atlanta stock, $402 million in Federal Reserve Bank of Atlanta stock, $69 million
in mutual fund investments, and $2 million of other.