SunTrust 2014 Annual Report Download - page 73
Download and view the complete annual report
Please find page 73 of the 2014 SunTrust annual report below. You can navigate through the pages in the report by either clicking on the pages listed below, or by using the keyword search tool below to find specific information within the annual report.-
 1
1 -
2
-
3
-
4
-
5
-
6
-
7
-
8
-
9
-
10
-
11
-
12
-
13
-
14
-
15
-
16
-
17
-
18
-
19
-
20
-
21
-
22
-
23
-
24
-
25
-
26
-
27
-
28
-
29
-
30
-
31
-
32
-
33
-
34
-
35
-
36
-
37
-
38
-
39
-
40
-
41
-
42
-
43
-
44
-
45
-
46
-
47
-
48
-
49
-
50
-
51
-
52
-
53
-
54
-
55
-
56
-
57
-
58
-
59
-
60
-
61
-
62
-
 63
63 -
 64
64 -
 65
65 -
 66
66 -
 67
67 -
 68
68 -
 69
69 -
 70
70 -
 71
71 -
 72
72 -
 73
73 -
 74
74 -
 75
75 -
 76
76 -
 77
77 -
 78
78 -
 79
79 -
 80
80 -
 81
81 -
 82
82 -
 83
83 -
84
-
85
-
86
-
87
-
88
-
89
-
90
-
91
-
92
-
93
-
94
-
95
-
96
-
97
-
98
-
99
-
100
-
101
-
102
-
103
-
104
-
105
-
106
-
107
-
108
-
109
-
110
-
111
-
112
-
113
-
114
-
115
-
116
-
117
-
118
-
119
-
120
-
121
-
122
-
123
-
124
-
125
-
126
-
127
-
128
-
129
-
130
-
131
-
132
-
133
-
134
-
135
-
136
-
137
-
138
-
139
-
140
-
141
-
142
-
143
-
144
-
145
-
146
-
147
-
148
-
149
-
150
-
151
-
152
-
153
-
154
-
155
-
156
-
157
-
158
-
159
-
160
-
161
-
162
-
163
-
164
-
165
-
166
-
167
-
168
-
169
-
170
-
171
-
172
-
173
-
174
-
175
-
176
-
177
-
178
-
179
-
180
-
181
-
182
-
183
-
184
-
185
-
186
-
187
-
188
-
189
-
190
-
191
-
192
-
193
-
194
-
195
-
196
-
197
-
198
-
199
 |
 |
50
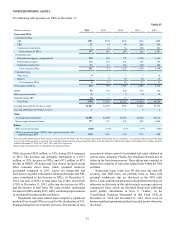
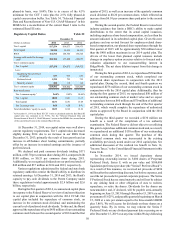
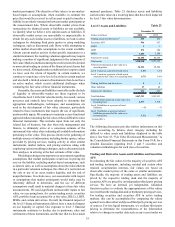
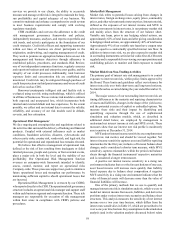
phased-in basis, was 9.69%. This is in excess of the 4.5%
minimum for the CET 1 ratio plus the 2.5% fully phased-in
capital conservation buffer. See Table 34, "Selected Financial
Data and Reconcilement of Non-U.S. GAAP Measures" in this
MD&A for a reconciliation of the current Basel I ratio to the
estimated Basel III ratio.
Regulatory Capital Ratios Table 22
December 31
(Dollars in millions) 2014 2013 2012
Tier 1 capital $17,554 $16,073 $14,975
Total capital 20,338 19,052 18,131
RWA 162,516 148,746 134,524
Average total assets for leverage
ratio 182,186 167,848 168,053
Tier 1 common equity:
Tier 1 capital $17,554 $16,073 $14,975
Less:
Qualifying trust preferred
securities 627 627 627
Preferred stock 1,225 725 725
Minority interest 108 119 114
Tier 1 common equity $15,594 $14,602 $13,509
Risk-based ratios:
Tier 1 common equity 19.60% 9.82% 10.04%
Tier 1 capital 10.80 10.81 11.13
Total capital 12.51 12.81 13.48
Tier 1 leverage ratio 9.64 9.58 8.91
Total shareholders’ equity to assets 12.09 12.22 12.10
1 At December 31, 2014, our Basel III CET 1 ratio as calculated under the final Basel III
capital rules was estimated to be 9.69%. See the "Selected Financial Data and
Reconcilement of Non-U.S. GAAP Measures" section in this MD&A for a reconciliation
of the current Basel I ratio to the estimated Basel III ratio.
At December 31, 2014, our capital ratios were well above
current regulatory requirements. Tier 1 capital ratios decreased
slightly during 2014 due to an increase in our RWA from
December 31, 2013, primarily the result of loan growth and an
increase in off-balance sheet lending commitments, partially
offset by an increase in retained earnings and the issuance of
preferred stock.
We declared and paid common dividends totaling $371
million, or $0.70 per common share during 2014, compared with
$188 million, or $0.35 per common share during 2013.
Additionally, we recognized dividends on our preferred stock of
$42 million and $37 million in 2014 and 2013, respectively.
Various regulations administered by federal and state bank
regulatory authorities restrict the Bank's ability to distribute its
retained earnings. At December 31, 2014 and 2013, the Bank's
capacity to pay cash dividends to the Parent Company under
these regulations totaled approximately $2.9 billion and $2.6
billion, respectively.
During the first quarter of 2014, we announced capital plans
in response to the Federal Reserve's review of and non-objection
to our capital plan in conjunction with the 2014 CCAR. Our
capital plan included the repurchase of common stock, an
increase in the common stock dividend, and maintaining the
current level of preferred stock dividends. To this end, the Board
approved the repurchase of up to $450 million of our outstanding
common stock between the second quarter of 2014 and the first
quarter of 2015, as well as an increase of the quarterly common
stock dividend to $0.20 per common share, which reflected an
increase from $0.10 per common share paid prior to the second
quarter.
During the second quarter, the Federal Reserve issued new
industry guidance that limits a BHC’s ability to make capital
distributions to the extent that its actual capital issuances,
including employee share-based compensation, are less than the
amount indicated in its submitted capital plan. Given this new
guidance and our revised forecast for employee-related share-
based compensation, our planned share repurchases through the
first quarter of 2015 will be approximately $50 million lower
than the $450 million maximum in our 2014 capital plan. The
drivers of the lower than planned capital issuance include
changes in employee option exercises relative to forecast and a
valuation adjustment to our noncontrolling interest in
RidgeWorth. The net share dilution impact from this change is
immaterial.
During the first quarter of 2014, we repurchased $50 million
of our outstanding common stock, which completed our
authorized share repurchases in conjunction with the 2013
capital plan. During the second, third and fourth quarters we
repurchased $278 million of our outstanding common stock in
conjunction with the 2014 capital plan. Additionally, thus far
during the first quarter of 2015, we repurchased $50 million of
our outstanding common stock at market value and we expect
to repurchase between $60 million and $70 million of additional
outstanding common stock through the end of the first quarter
of 2015, which would complete the repurchase of authorized
shares as approved by the Board in conjunction with the 2014
capital plan.
During the third quarter we recorded a $130 million tax
benefit as a result of the completion of a tax authority
examination. The Federal Reserve did not object to us utilizing
this gain to repurchase additional common stock and, as a result,
we repurchased an additional $130 million of our outstanding
common stock during that quarter. The purchase of this
additional common stock was incremental to the existing
availability previously noted under our 2014 capital plan. See
additional discussion of the realized tax benefit in Note 14,
"Income Taxes," to the Consolidated Financial Statements in this
Form 10-K.
In November 2014, we issued depositary shares
representing ownership interest in 5,000 shares of Perpetual
Preferred Stock, Series F, with no par value and $100,000
liquidation preference per share (the "Series F Preferred Stock").
As a result of this issuance, we received net proceeds of $496
million after the underwriting discount, but before expenses, and
used the net proceeds for general corporate purposes. The Series
F Preferred Stock has no stated maturity and will not be subject
to any sinking fund or other obligation of ours to redeem,
repurchase, or retire the shares. Dividends for the shares are
noncumulative and, if declared, will be payable semi-annually
beginning on June 15, 2015 through December 15, 2019 at a rate
per annum of 5.625%, and payable quarterly beginning on March
15, 2020 at a rate per annum equal to the three-month LIBOR
plus 3.86%. We will accrue for dividends on these shares on a
quarterly basis. By its terms, we may redeem the Series F
Preferred Stock on any dividend payment date occurring on or
after December 15, 2019 or at any time within 90 days following