SunTrust 2014 Annual Report Download - page 143
Download and view the complete annual report
Please find page 143 of the 2014 SunTrust annual report below. You can navigate through the pages in the report by either clicking on the pages listed below, or by using the keyword search tool below to find specific information within the annual report.-
 1
1 -
2
-
3
-
4
-
5
-
6
-
7
-
8
-
9
-
10
-
11
-
12
-
13
-
14
-
15
-
16
-
17
-
18
-
19
-
20
-
21
-
22
-
23
-
24
-
25
-
26
-
27
-
28
-
29
-
30
-
31
-
32
-
33
-
34
-
35
-
36
-
37
-
38
-
39
-
40
-
41
-
42
-
43
-
44
-
45
-
46
-
47
-
48
-
49
-
50
-
51
-
52
-
53
-
54
-
55
-
56
-
57
-
58
-
59
-
60
-
61
-
62
-
63
-
64
-
65
-
66
-
67
-
68
-
69
-
70
-
71
-
72
-
73
-
74
-
75
-
76
-
77
-
78
-
79
-
80
-
81
-
82
-
83
-
84
-
85
-
86
-
87
-
88
-
89
-
90
-
91
-
92
-
93
-
94
-
95
-
96
-
97
-
98
-
99
-
100
-
101
-
102
-
103
-
104
-
105
-
106
-
107
-
108
-
109
-
110
-
111
-
112
-
113
-
114
-
115
-
116
-
117
-
118
-
119
-
120
-
121
-
122
-
123
-
124
-
125
-
126
-
127
-
128
-
129
-
130
-
131
-
132
-
 133
133 -
 134
134 -
 135
135 -
 136
136 -
 137
137 -
 138
138 -
 139
139 -
 140
140 -
 141
141 -
 142
142 -
 143
143 -
 144
144 -
 145
145 -
 146
146 -
 147
147 -
 148
148 -
 149
149 -
 150
150 -
 151
151 -
 152
152 -
 153
153 -
154
-
155
-
156
-
157
-
158
-
159
-
160
-
161
-
162
-
163
-
164
-
165
-
166
-
167
-
168
-
169
-
170
-
171
-
172
-
173
-
174
-
175
-
176
-
177
-
178
-
179
-
180
-
181
-
182
-
183
-
184
-
185
-
186
-
187
-
188
-
189
-
190
-
191
-
192
-
193
-
194
-
195
-
196
-
197
-
198
-
199
 |
 |
Notes to Consolidated Financial Statements, continued
120
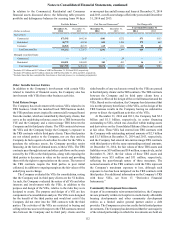
The expected volatility represented the implied volatility of
SunTrust stock. The expected term represented the period of time
that the stock options granted were expected to be outstanding
and was derived from historical data that was used to evaluate
patterns such as stock option exercise and employee termination.
The Company used the projected dividend to be paid as the
dividend yield assumption. The risk-free interest rate is derived
from the U.S. Treasury yield curve in effect at the time of grant
based on the expected life of the option.
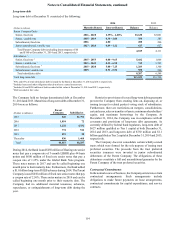
Stock options were granted at an exercise price that was no
less than the fair market value of a share of SunTrust common
stock on the grant date and were either tax-qualified incentive
stock options or non-qualified stock options. Stock options
typically vest pro-rata over three years and generally have a
maximum contractual life of ten years. Upon exercise, shares are
generally issued from treasury stock. The weighted average fair
value of options granted during years ended December 31, 2013
and 2012 were $7.37 and $7.83, respectively, per share.
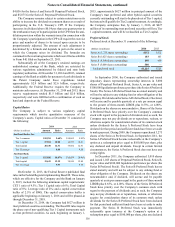
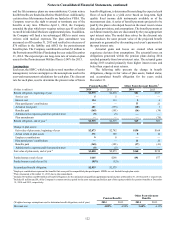
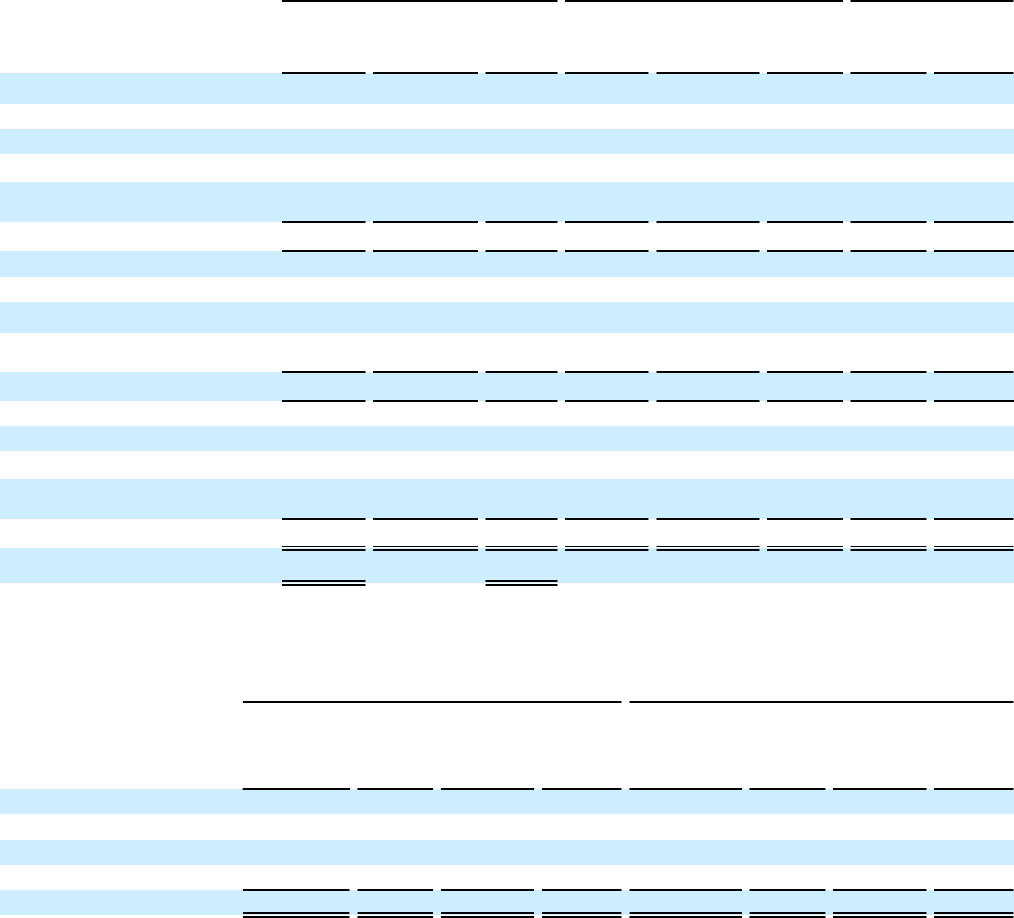
The following table presents a summary of stock option and restricted stock activity:
Stock Options Restricted Stock Restricted Stock Units
(Dollars in millions, except per share data) Shares Price
Range
Weighted
Average
Exercise
Price Shares Deferred
Compensation
Weighted
Average
Grant
Price Shares
Weighted
Average
Grant
Price
Balance, January 1, 2012 15,869,417 9.06 - 150.45 $48.53 4,622,167 $48 $21.46 405,475 $35.98
Granted 859,390 21.67 - 23.68 21.92 1,737,202 38 21.97 1,717,148 22.65
Exercised/vested (973,048) 9.06 - 22.69 9.90 (2,148,764) — 14.62 (109,149) 27.73
Cancelled/expired/forfeited (2,444,107) 9.06 - 85.06 45.73 (524,284) (8) 19.91 (82,828) 22.79
Amortization of restricted stock
compensation — — — — (30) — — —
Balance, December 31, 2012 13,311,652 9.06 - 150.45 50.15 3,686,321 48 25.56 1,930,646 25.16
Granted 552,998 27.41 27.41 1,314,277 39 29.58 593,093 24.65
Exercised/vested (712,981) 9.06 - 27.79 16.94 (821,636) — 25.95 (41,790) 28.73
Cancelled/expired/forfeited (2,222,298) 21.67 - 118.18 56.55 (195,424) (5) 27.41 14,229 20.54
Amortization of restricted stock
compensation — — — — (32) — — —
Balance, December 31, 2013 10,929,371 $9.06 - 150.45 49.86 3,983,538 50 27.04 2,496,178 26.69
Granted — — — 21,427 — 39.20 1,590,075 36.67
Exercised/vested (426,889) 9.06 - 32.27 20.86 (957,308) — 29.31 (338,196) 32.80
Cancelled/expired/forfeited (2,774,725) 23.70 - 149.81 71.10 (117,798) (2) 25.60 (58,793) 37.73
Amortization of restricted stock
compensation — — — — (27) — — —
Balance, December 31, 2014 7,727,757 $9.06 - 150.45 $43.84 2,929,859 $21 $26.45 3,689,264 $31.15
Exercisable, December 31, 2014 7,106,639 $45.47
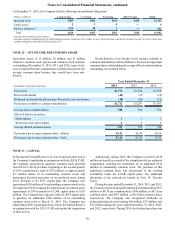
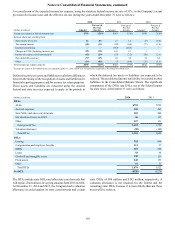
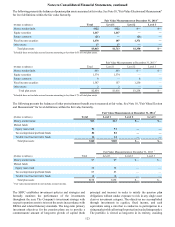
The following table presents stock option information at December 31, 2014:
Options Outstanding Options Exercisable
(Dollars in millions, except per share data)
Number
Outstanding
at
December 31,
2014
Weighted
Average
Exercise
Price
Weighted
Average
Remaining
Contractual
Life (Years)
Total
Aggregate
Intrinsic
Value
Number
Exercisable
at
December 31,
2014
Weighted
Average
Exercise
Price
Weighted
Average
Remaining
Contractual
Life (Years)
Total
Aggregate
Intrinsic
Value
Range of Exercise Prices:
$9.06 to 49.46 4,174,504 $19.63 5.18 $93 3,553,386 $18.66 4.73 $83
$49.47 to 64.57 781 56.34 2.84 — 781 56.34 2.84 —
$64.58 to 150.45 3,552,472 72.29 1.16 — 3,552,472 72.29 1.16 —
7,727,757 $43.84 3.33 $93 7,106,639 $45.47 2.95 $83
The aggregate intrinsic value in the preceding table represents
the total pre-tax intrinsic value (the difference between the
Company’s closing stock price on the last trading day of 2014
and the exercise price, multiplied by the number of in-the-money
stock options) that would have been received by the option
holders had all option holders exercised their options on
December 31, 2014.