SunTrust 2014 Annual Report Download - page 61
Download and view the complete annual report
Please find page 61 of the 2014 SunTrust annual report below. You can navigate through the pages in the report by either clicking on the pages listed below, or by using the keyword search tool below to find specific information within the annual report.-
 1
1 -
2
-
3
-
4
-
5
-
6
-
7
-
8
-
9
-
10
-
11
-
12
-
13
-
14
-
15
-
16
-
17
-
18
-
19
-
20
-
21
-
22
-
23
-
24
-
25
-
26
-
27
-
28
-
29
-
30
-
31
-
32
-
33
-
34
-
35
-
36
-
37
-
38
-
39
-
40
-
41
-
42
-
43
-
44
-
45
-
46
-
47
-
48
-
49
-
50
-
 51
51 -
 52
52 -
 53
53 -
 54
54 -
 55
55 -
 56
56 -
 57
57 -
 58
58 -
 59
59 -
 60
60 -
 61
61 -
 62
62 -
 63
63 -
 64
64 -
 65
65 -
 66
66 -
 67
67 -
 68
68 -
 69
69 -
 70
70 -
 71
71 -
72
-
73
-
74
-
75
-
76
-
77
-
78
-
79
-
80
-
81
-
82
-
83
-
84
-
85
-
86
-
87
-
88
-
89
-
90
-
91
-
92
-
93
-
94
-
95
-
96
-
97
-
98
-
99
-
100
-
101
-
102
-
103
-
104
-
105
-
106
-
107
-
108
-
109
-
110
-
111
-
112
-
113
-
114
-
115
-
116
-
117
-
118
-
119
-
120
-
121
-
122
-
123
-
124
-
125
-
126
-
127
-
128
-
129
-
130
-
131
-
132
-
133
-
134
-
135
-
136
-
137
-
138
-
139
-
140
-
141
-
142
-
143
-
144
-
145
-
146
-
147
-
148
-
149
-
150
-
151
-
152
-
153
-
154
-
155
-
156
-
157
-
158
-
159
-
160
-
161
-
162
-
163
-
164
-
165
-
166
-
167
-
168
-
169
-
170
-
171
-
172
-
173
-
174
-
175
-
176
-
177
-
178
-
179
-
180
-
181
-
182
-
183
-
184
-
185
-
186
-
187
-
188
-
189
-
190
-
191
-
192
-
193
-
194
-
195
-
196
-
197
-
198
-
199
 |
 |

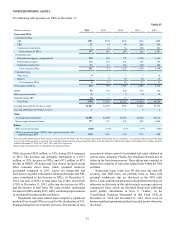
38
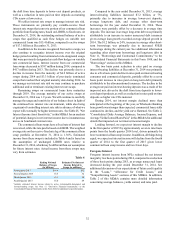
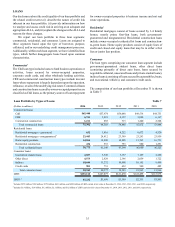
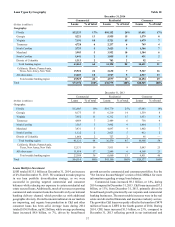
regional businesses, including the purchase of approximately
$735 million in loans from third parties during 2014.
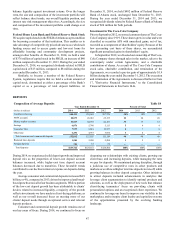
Residential loans decreased $4.4 billion, or 10%, during
2014 compared to December 31, 2013, primarily driven by a
$2.8 billion, or 81%, decrease in government-guaranteed
residential mortgages, a $969 million, or 4%, decrease in non-
guaranteed residential mortgages, and a $545 million, or 4%,
decrease in home equity products. The decrease in government-
guaranteed loans was primarily due to the sale of $2.3 billion in
government-guaranteed residential mortgages on a servicing
retained basis, resulting in $60 million of pre-tax gains during
2014. The decrease in nonguaranteed residential mortgages was
driven by payments and charge-offs, partly offset by new
originations, and the sale of $207 million of accruing TDRs and
NPLs to further enhance our asset quality position, resulting in
a $6 million gain, as well as the sale of $253 million of performing
nonguaranteed mortgages, resulting in an insignificant loss.
At December 31, 2014, 39% of our home equity products
were in a first lien position and 61% were in a junior lien position.
For home equity products in a junior lien position, we own or
service 29% of the loans that are senior to the home equity
product. Additionally, approximately 16% of the home equity
line portfolio is due to convert to amortizing term loans by the
end of 2015 and an additional 45% enter the conversion phase
over following three years. Based on historical trends, within 12
months of the end of their draw period, approximately 77% of
all accounts, and approximately 65% of accounts with a balance,
are closed or refinanced into an amortizing loan or a new line of
credit. We perform credit management activities to limit our loss
exposure on home equity accounts. These activities may result
in the suspension of available credit and curtailment of available
draws of most home equity junior lien accounts when the first
lien position is delinquent, including when the junior lien is still
current. We monitor the delinquency status of first mortgages
serviced by other parties. Additionally, we actively monitor
refreshed credit bureau scores of borrowers with junior liens, as
these scores are highly sensitive to first lien mortgage
delinquency. At December 31, 2014 and 2013, our home equity
junior lien loss severity was approximately 80% and 87%,
respectively. The average borrower FICO score related to loans
in our home equity portfolio was approximately 760 at both
December 31, 2014 and 2013, and the average outstanding loan
size was approximately $46,000 and $48,000 at December 31,
2014 and 2013, respectively.
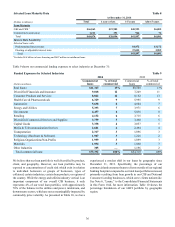
Consumer loans increased $568 million, or 3%, during 2014
compared to December 31, 2013. The increase is attributable to
the $1.7 billion, or 62%, increase in other direct loans, which
was largely related to origination of high credit quality consumer
loans through our LightStream online lending business, as well
as other high credit quality home improvement loans. The
increase in consumer loans was partially offset by the $718
million, or 13%, decrease in government-guaranteed student
loans and the $628 million, or 6%, decrease in indirect loans
during 2014 compared to December 31, 2013. The decrease in
government-guaranteed student loans was due to paydowns and
the sale of $335 million of these loans during the fourth quarter
of 2014. Indirect loans decreased due to the sale of approximately
$475 million of indirect auto loans and the transfer of
approximately $600 million of indirect auto loans to LHFS in
the fourth quarter of 2014, partially offset by growth in our
portfolio. The net gain or loss on the sale and transfer of the
indirect auto and student loans was immaterial.
Collectively, these loan sale transactions during the year,
along with the loan transfers described below, were part of our
strategy to optimize our balance sheet and improve returns.
Going forward, we will continue to opportunistically evaluate
loan sales to further this strategy.
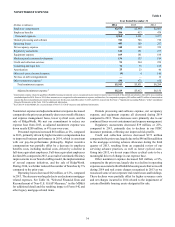
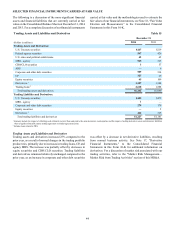
Loans Held for Sale
LHFS increased $1.5 billion, or 90%, from December 31, 2013
to December 31, 2014, primarily reflecting the approximately
$600 million of indirect auto loans and $470 million of C&I loans
transferred from LHFI to LHFS as part of our strategy to optimize
our balance sheet and improve returns. Also contributing to the
increase in LHFS was an increase in mortgage loan volume
towards the end of 2014 as the continued low interest rate
environment drove higher production.
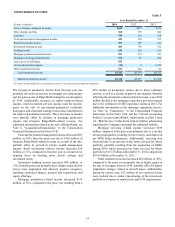
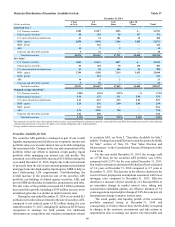
Asset Quality
The asset quality condition of our loan portfolio continued to
trend favorably during 2014, driven by overall improvements in
the economy, improved residential housing markets, resolution
of existing NPAs, and lower levels of new NPLs. This was
primarily driven by positive trends in our residential portfolios
reflected in lower delinquencies, lower loss severities, and higher
prices upon disposition of foreclosed assets. The overall
improvement in asset quality is also the result of significant
actions we have taken over the past several years to de-risk and
diversify our balance sheet and improve the quality of new loan
production.
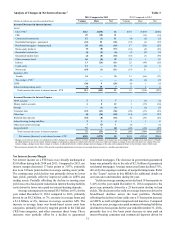
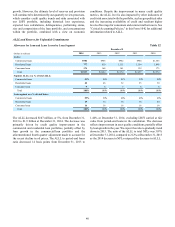
NPLs decreased $337 million, or 35%, compared to
December 31, 2013, largely driven by a reduction in residential
mortgage NPLs. At December 31, 2014, the percentage of NPLs
to total loans was 0.48%, down 28 basis points compared to
December 31, 2013. We expect further, though moderating,
declines in NPLs in the near term, primarily driven by
improvements in the residential mortgage portfolios.
Net charge-offs were $445 million during 2014, compared
to $678 million during 2013, a decrease of $233 million, or 34%,
largely driven by declines in the commercial and residential
categories, partially offset by a slight increase in indirect auto
loan charge-offs within the consumer category. During 2014, the
net charge-off ratio declined to 0.34%, compared to 0.55%
during 2013. It is unlikely that we will be able to sustain the level
of our current net charge-off ratio over the long-term, though we
are not expecting a significant increase in 2015 relative to 2014.
We expect net charge-offs in the residential portfolio to move
modestly lower in the near-term. We do not expect further
declines in commercial and consumer net charge-offs, which we
believe are at or below normal levels.
Total early stage delinquencies decreased 10 basis points
from December 31, 2013 to 0.64% of total loans at December 31,
2014. Early stage delinquencies, excluding government-
guaranteed loans, improved six basis points from December 31,
2013 to 0.30% of total loans at December 31, 2014. At
December 31, 2014, all loan classes, except residential
construction and consumer indirect, showed improvement in
early stage delinquencies compared to December 31, 2013.