SunTrust 2014 Annual Report Download - page 54
Download and view the complete annual report
Please find page 54 of the 2014 SunTrust annual report below. You can navigate through the pages in the report by either clicking on the pages listed below, or by using the keyword search tool below to find specific information within the annual report.-
 1
1 -
2
-
3
-
4
-
5
-
6
-
7
-
8
-
9
-
10
-
11
-
12
-
13
-
14
-
15
-
16
-
17
-
18
-
19
-
20
-
21
-
22
-
23
-
24
-
25
-
26
-
27
-
28
-
29
-
30
-
31
-
32
-
33
-
34
-
35
-
36
-
37
-
38
-
39
-
40
-
41
-
42
-
43
-
 44
44 -
 45
45 -
 46
46 -
 47
47 -
 48
48 -
 49
49 -
 50
50 -
 51
51 -
 52
52 -
 53
53 -
 54
54 -
 55
55 -
 56
56 -
 57
57 -
 58
58 -
 59
59 -
 60
60 -
 61
61 -
 62
62 -
 63
63 -
 64
64 -
65
-
66
-
67
-
68
-
69
-
70
-
71
-
72
-
73
-
74
-
75
-
76
-
77
-
78
-
79
-
80
-
81
-
82
-
83
-
84
-
85
-
86
-
87
-
88
-
89
-
90
-
91
-
92
-
93
-
94
-
95
-
96
-
97
-
98
-
99
-
100
-
101
-
102
-
103
-
104
-
105
-
106
-
107
-
108
-
109
-
110
-
111
-
112
-
113
-
114
-
115
-
116
-
117
-
118
-
119
-
120
-
121
-
122
-
123
-
124
-
125
-
126
-
127
-
128
-
129
-
130
-
131
-
132
-
133
-
134
-
135
-
136
-
137
-
138
-
139
-
140
-
141
-
142
-
143
-
144
-
145
-
146
-
147
-
148
-
149
-
150
-
151
-
152
-
153
-
154
-
155
-
156
-
157
-
158
-
159
-
160
-
161
-
162
-
163
-
164
-
165
-
166
-
167
-
168
-
169
-
170
-
171
-
172
-
173
-
174
-
175
-
176
-
177
-
178
-
179
-
180
-
181
-
182
-
183
-
184
-
185
-
186
-
187
-
188
-
189
-
190
-
191
-
192
-
193
-
194
-
195
-
196
-
197
-
198
-
199
 |
 |

31
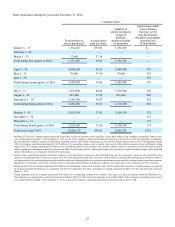
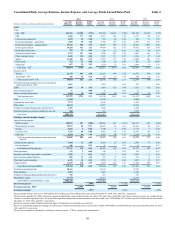
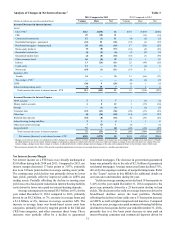
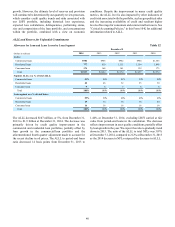
Analysis of Changes in Net Interest Income 1Table 3
2014 Compared to 2013 2013 Compared to 2012
(Dollars in millions on a taxable-equivalent basis) Volume Rate Net Volume Rate Net
Increase/(Decrease) in Interest Income
Loans:
C&I - FTE 2$241 ($238) $3 $155 ($303) ($148)
CRE 49 (18) 31 — (19) (19)
Commercial construction 12 (1) 11 (4) (3) (7)
Residential mortgages - guaranteed (61) 25 (36) (53) (6) (59)
Residential mortgages - nonguaranteed 28 (42) (14) 17 (82) (65)
Home equity products (5) (8) (13) (18) (8) (26)
Residential construction (4) (2) (6) (7) (2) (9)
Guaranteed student loans (2) (8) (10) (55) (3) (58)
Other consumer direct 46 (4) 42 13 1 14
Indirect 13 (24) (11) 22 (48) (26)
Credit cards 13 — 13 7 (2) 5
Nonaccrual (10) (1) (11) (19) 21 2
Securities AFS:
Taxable 34 — 34 15 (86) (71)
Tax-exempt - FTE 2— — — (6) (1) (7)
LHFS (38) 9 (29) (6) 1 (5)
Interest earning trading assets (3) 10 7 2 2 4
Total increase/(decrease) in interest income - FTE 313 (302) 11 63 (538) (475)
Increase/(Decrease) in Interest Expense
NOW accounts 2 3 5 1 (7) (6)
Money market accounts 4 8 12 1 (35) (34)
Savings — (1) (1) 1 (3) (2)
Consumer time (15) (21) (36) (20) (23) (43)
Other time (8) (10) (18) (14) (13) (27)
Brokered time deposits (10) (8) (18) (6) (20) (26)
Interest-bearing trading liabilities 3 1 4 1 1 2
Other short-term borrowings 3 (2) 1 (5) — (5)
Long-term debt 53 7 60 (45) (44) (89)
Total increase/(decrease) in interest expense 32 (23) 9 (86) (144) (230)
Net increase/(decrease) in net interest income - FTE $281 ($279) $2 $149 ($394) ($245)
1 Changes in net interest income are attributed to either changes in average balances (volume change) or changes in average rates (rate change) for earning assets and sources of funds
on which interest is received or paid. Volume change is calculated as change in volume times the previous rate, while rate change is change in rate times the previous volume. The rate/
volume change, change in rate times change in volume, is allocated between volume change and rate change at the ratio each component bears to the absolute value of their total.
2 Interest income includes the effects of the taxable-equivalent adjustments to increase tax-exempt interest income to a taxable-equivalent basis.
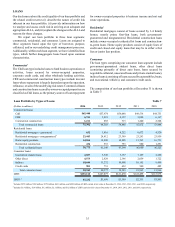
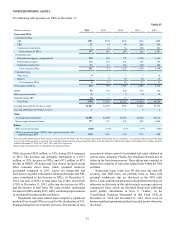
Net Interest Income/Margin
Net interest income on a FTE basis was virtually unchanged at
$5.0 billion during both 2014 and 2013. Compared to 2013, net
interest margin decreased 17 basis points to 3.07%, primarily
due to an 18 basis point decline in average earning asset yields.
The earning asset yield decline was primarily driven by lower
loan yields, partially offset by improved yields in LHFS and
trading assets. Partially offsetting the decline in earning asset
yield was a two basis point reduction in interest bearing liability
costs driven by lower rates paid on interest-bearing deposits.
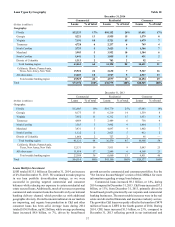
Average earning assets increased $8.5 billion, or 6%, for the
year ended December 31, 2014 compared to 2013, primarily
driven by an $8.2 billion, or 7%, increase in average loans and
a $1.4 billion, or 6%, increase in average securities AFS. The
increase in average loans was broad-based across most loan
categories, primarily driven by targeted growth in the C&I and
CRE loan categories, and other consumer direct loans. These
increases were partially offset by a decline in guaranteed
residential mortgages. The decrease in government-guaranteed
loans was primarily due to the sale of $2.3 billion of guaranteed
residential mortgages. Average nonaccrual loans declined 31%,
driven by the ongoing resolution of nonperforming loans. Refer
to the "Loans" section in this MD&A for additional details on
our loan sales and transfers during the year.
Yields on average earning assets declined 18 basis points to
3.41% for the year ended December 31, 2014 compared to the
prior year, primarily driven by a 25 basis point decline in loan
yields. The decrease in the yield on average loans was driven by
broad-based declines across the loan portfolio. Partially
offsetting the decline in loan yields was a 31 basis point increase
on LHFS, as well as higher margin-related loan fees. Compared
to the prior year, average rates paid on interest-bearing liabilities
declined two basis points for the year ended December 31, 2014,
primarily due to a five basis point decrease in rates paid on
interest-bearing consumer and commercial deposits driven by