SunTrust 2014 Annual Report Download - page 55
Download and view the complete annual report
Please find page 55 of the 2014 SunTrust annual report below. You can navigate through the pages in the report by either clicking on the pages listed below, or by using the keyword search tool below to find specific information within the annual report.-
 1
1 -
2
-
3
-
4
-
5
-
6
-
7
-
8
-
9
-
10
-
11
-
12
-
13
-
14
-
15
-
16
-
17
-
18
-
19
-
20
-
21
-
22
-
23
-
24
-
25
-
26
-
27
-
28
-
29
-
30
-
31
-
32
-
33
-
34
-
35
-
36
-
37
-
38
-
39
-
40
-
41
-
42
-
43
-
44
-
 45
45 -
 46
46 -
 47
47 -
 48
48 -
 49
49 -
 50
50 -
 51
51 -
 52
52 -
 53
53 -
 54
54 -
 55
55 -
 56
56 -
 57
57 -
 58
58 -
 59
59 -
 60
60 -
 61
61 -
 62
62 -
 63
63 -
 64
64 -
 65
65 -
66
-
67
-
68
-
69
-
70
-
71
-
72
-
73
-
74
-
75
-
76
-
77
-
78
-
79
-
80
-
81
-
82
-
83
-
84
-
85
-
86
-
87
-
88
-
89
-
90
-
91
-
92
-
93
-
94
-
95
-
96
-
97
-
98
-
99
-
100
-
101
-
102
-
103
-
104
-
105
-
106
-
107
-
108
-
109
-
110
-
111
-
112
-
113
-
114
-
115
-
116
-
117
-
118
-
119
-
120
-
121
-
122
-
123
-
124
-
125
-
126
-
127
-
128
-
129
-
130
-
131
-
132
-
133
-
134
-
135
-
136
-
137
-
138
-
139
-
140
-
141
-
142
-
143
-
144
-
145
-
146
-
147
-
148
-
149
-
150
-
151
-
152
-
153
-
154
-
155
-
156
-
157
-
158
-
159
-
160
-
161
-
162
-
163
-
164
-
165
-
166
-
167
-
168
-
169
-
170
-
171
-
172
-
173
-
174
-
175
-
176
-
177
-
178
-
179
-
180
-
181
-
182
-
183
-
184
-
185
-
186
-
187
-
188
-
189
-
190
-
191
-
192
-
193
-
194
-
195
-
196
-
197
-
198
-
199
 |
 |

32
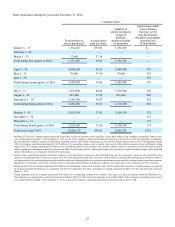
the shift from time deposits to lower-cost deposit products, as
well as a reduction in rates paid on time deposits as maturing
CDs renew at lower rates.
We utilize interest rate swaps to manage interest rate risk.
These instruments are primarily pay variable-receive fixed
interest rate swaps that convert a portion of our commercial loan
portfolio from floating rates, based on LIBOR, to fixed rates. At
December 31, 2014, the outstanding notional balance of active
swaps that qualified as cash flow hedges on variable rate
commercial loans was $15.4 billion, compared to active swaps
of $17.3 billion at December 31, 2013.
In addition to the income recognized from active swaps, we
also continue to recognize interest income over the original
hedge period resulting from terminated or de-designated swaps
that were previously designated as cash flow hedges on variable
rate commercial loans. Interest income from our commercial
loan swaps decreased to $387 million during 2014, compared to
$417 million during 2013. The decline was primarily due to a
decline in income from the maturity of $4.2 billion of active
swaps during 2014 and $3.3 billion of previously terminated
swaps that reached their original maturity date during 2014. As
we manage our interest rate risk we may continue to purchase
additional and/or terminate existing interest rate swaps.
Remaining swaps on commercial loans have maturities
through 2019. The average maturity of our active swaps at
December 31, 2014 was 1.9 years. We will continue to carefully
manage the usage and sensitivity of our balance sheet in light of
the continued low interest rate environment, while also being
cognizant of controlling interest rate risk in advance of what we
expect will eventually be higher interest rates. See Table 25, "Net
Interest Income Asset Sensitivity," in this MD&A for an analysis
of potential changes in net interest income due to instantaneous
moves in benchmark interest rates.
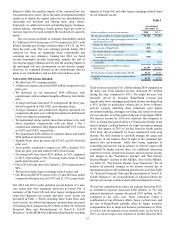
The commercial loan swaps have a fixed rate of interest that
is received, while the rate paid is based on LIBOR. The weighted
average rate on the receive-fixed rate leg of the commercial loan
swap portfolio at December 31, 2014 is 1.36%. Estimated
income from these swaps is included in Table 4 and is based on
the assumption of unchanged LIBOR rates relative to
December 31, 2014, which may be different than our assumption
for future interest rates. Actual income from these swaps may
vary from estimates.
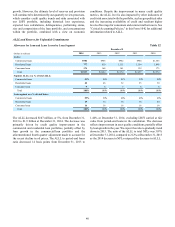
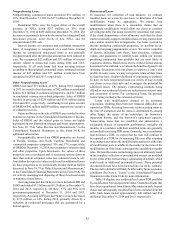
Table 4
Ending Notional
Balance of Swaps
(in billions)
Estimated Net Interest
Income Related to
Swaps (in millions) 1
First Quarter 2015 $14.0 $52
Second Quarter 2015 15.5 52
Third Quarter 2015 15.1 50
Fourth Quarter 2015 15.0 49
1 Includes estimated interest income related to active, terminated/de-designated, and
forward-starting swaps. See Note 17, "Derivative Financial Instruments," to the
Consolidated Financial Statements in this Form 10-K for additional swap information.
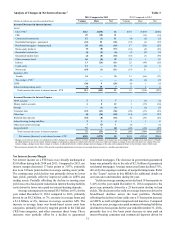
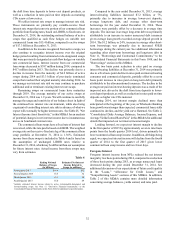
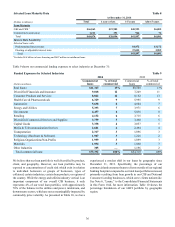
Compared to the year ended December 31, 2013, average
interest-bearing liabilities increased $7.2 billion, or 7%,
primarily due to increases in average lower-cost deposits,
average long-term debt, and average other short-term
borrowings for the year ended December 31, 2014. These
increases were partially offset by a decrease in average time
deposits. The increase in average long-term debt was primarily
attributable to an increase in senior unsecured debt issuances
given average loan growth exceeded average deposit growth in
2014. The $1.2 billion, or 24%, increase in average other short-
term borrowings was primarily due to increased FHLB
borrowings during the current year. See additional information
regarding other short-term borrowings and long-term debt in
Note 11, "Borrowings and Contractual Commitments," to the
Consolidated Financial Statements in this Form 10-K and the
"Borrowings" section in this MD&A.
The two basis point reduction in rates paid on average
interest-bearing liabilities at December 31, 2014 was primarily
due to a five basis point decline in rates paid on interest-bearing
consumer and commercial deposits, partially offset by a seven
basis point increase in rates paid on long-term debt primarily
attributable to the aforementioned issuances. The decline in the
average rate paid on interest-bearing deposits was a result of the
improved mix driven by the shift from time deposits to lower-
cost deposit products, as well as a reduction in rates paid on time
deposits as higher rate CDs matured.
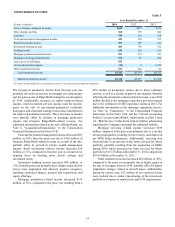
During 2014, net interest margin declined more than
anticipated at the beginning of the year, as Wholesale Banking
loan growth was stronger than expected, commercial loan yields
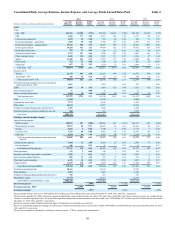
continued to decline, and the yield curve flattened. See Table 2,
"Consolidated Daily Average Balances, Income/Expense, and
Average Yields Earned/Rates Paid," in this MD&A for additional
details that impacted our net interest income/margin.
Looking forward, we expect net interest margin to decline
in the first quarter of 2015 by approximately seven to nine basis
points from the fourth quarter 2014 level, driven primarily by
lower commercial loan swap income. In addition, all things being
equal, we expect net interest income will decline from the fourth
quarter of 2014 to the first quarter of 2015 given lower
commercial loan swap income and two fewer days.
Foregone Interest
Foregone interest income from NPLs reduced the net interest
margin by two basis points during 2014, compared to a reduction
of three basis points during 2013, as average nonaccrual loans
decreased during the year ended December 31, 2014. See
additional discussion of our expectations of future credit quality
in the “Loans,” “Allowance for Credit Losses,” and
“Nonperforming Assets” sections of this MD&A. In addition,
Table 2 of this MD&A contains more detailed information
concerning average balances, yields earned, and rates paid.