SunTrust 2014 Annual Report Download - page 60
Download and view the complete annual report
Please find page 60 of the 2014 SunTrust annual report below. You can navigate through the pages in the report by either clicking on the pages listed below, or by using the keyword search tool below to find specific information within the annual report.-
 1
1 -
2
-
3
-
4
-
5
-
6
-
7
-
8
-
9
-
10
-
11
-
12
-
13
-
14
-
15
-
16
-
17
-
18
-
19
-
20
-
21
-
22
-
23
-
24
-
25
-
26
-
27
-
28
-
29
-
30
-
31
-
32
-
33
-
34
-
35
-
36
-
37
-
38
-
39
-
40
-
41
-
42
-
43
-
44
-
45
-
46
-
47
-
48
-
49
-
 50
50 -
 51
51 -
 52
52 -
 53
53 -
 54
54 -
 55
55 -
 56
56 -
 57
57 -
 58
58 -
 59
59 -
 60
60 -
 61
61 -
 62
62 -
 63
63 -
 64
64 -
 65
65 -
 66
66 -
 67
67 -
 68
68 -
 69
69 -
 70
70 -
71
-
72
-
73
-
74
-
75
-
76
-
77
-
78
-
79
-
80
-
81
-
82
-
83
-
84
-
85
-
86
-
87
-
88
-
89
-
90
-
91
-
92
-
93
-
94
-
95
-
96
-
97
-
98
-
99
-
100
-
101
-
102
-
103
-
104
-
105
-
106
-
107
-
108
-
109
-
110
-
111
-
112
-
113
-
114
-
115
-
116
-
117
-
118
-
119
-
120
-
121
-
122
-
123
-
124
-
125
-
126
-
127
-
128
-
129
-
130
-
131
-
132
-
133
-
134
-
135
-
136
-
137
-
138
-
139
-
140
-
141
-
142
-
143
-
144
-
145
-
146
-
147
-
148
-
149
-
150
-
151
-
152
-
153
-
154
-
155
-
156
-
157
-
158
-
159
-
160
-
161
-
162
-
163
-
164
-
165
-
166
-
167
-
168
-
169
-
170
-
171
-
172
-
173
-
174
-
175
-
176
-
177
-
178
-
179
-
180
-
181
-
182
-
183
-
184
-
185
-
186
-
187
-
188
-
189
-
190
-
191
-
192
-
193
-
194
-
195
-
196
-
197
-
198
-
199
 |
 |

37
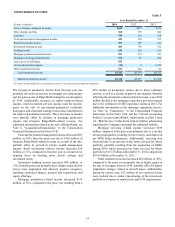
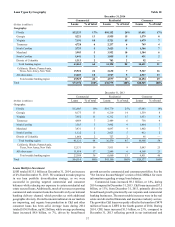
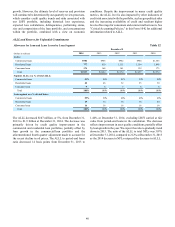
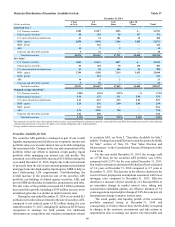
Loan Types by Geography Table 10
December 31, 2014
Commercial Residential Consumer
(Dollars in millions) Loans % of total Loans % of total Loans % of total
Geography:
Florida $12,333 17% $10,152 26% $3,651 17%
Georgia 9,221 13 5,955 15 1,579 8
Virginia 7,191 10 5,721 15 1,479 7
Tennessee 4,728 6 2,237 6 749 4
North Carolina 3,733 5 3,623 9 1,366 7
Maryland 3,903 5 3,952 10 1,304 6
South Carolina 1,441 2 1,855 5 431 2
District of Columbia 1,313 2 703 2 92 —
Total banking region 43,863 60 34,198 88 10,651 51
California, Illinois, Pennsylvania,
Texas, New Jersey, New York 15,926 22 2,630 7 5,367 26
All other states 13,603 18 1,947 5 4,927 23
Total outside banking region 29,529 40 4,577 12 10,294 49
Total $73,392 100% $38,775 100% $20,945 100%
December 31, 2013
Commercial Residential Consumer
(Dollars in millions) Loans % of total Loans % of total Loans % of total
Geography:
Florida $12,003 19% $10,770 25% $3,683 18%
Georgia 8,175 13 6,210 14 1,539 8
Virginia 7,052 11 6,312 15 1,633 8
Tennessee 4,689 7 2,489 6 738 4
North Carolina 3,583 5 3,902 9 1,464 7
Maryland 3,431 5 4,097 9 1,402 7
South Carolina 1,122 2 2,023 5 412 2
District of Columbia 1,066 2 727 2 95 —
Total banking region 41,121 64 36,530 85 10,966 54
California, Illinois, Pennsylvania,
Texas, New Jersey, New York 12,131 19 3,811 9 5,043 25
All other states 11,058 17 2,849 6 4,368 21
Total outside banking region 23,189 36 6,660 15 9,411 46
Total $64,310 100% $43,190 100% $20,377 100%
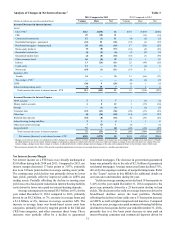
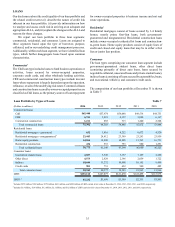
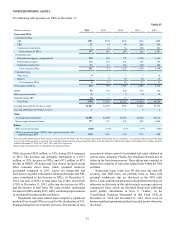
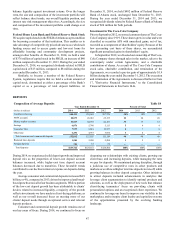
Loans Held for Investment
LHFI totaled $133.1 billion at December 31, 2014, an increase
of 4% from December 31, 2013. We continued to make progress
in our loan portfolio diversification strategy, as we were
successful in growing targeted commercial and consumer
balances while reducing our exposure to certain residential real
estate secured loans. Additionally, much of our success growing
commercial and consumer loans has been driven by our national
banking delivery channel, which provides us with additional
geographic diversity. Overall economic indicators in our markets
are improving, and organic loan production in C&I and other
consumer loans has been solid. Average loans during 2014
totaled $130.9 billion, up $8.2 billion, while average performing
loans increased $8.6 billion, or 7%, driven by broad-based
growth across the commercial and consumer portfolios. See the
"Net Interest Income/Margin" section of this MD&A for more
information regarding average loan balances.
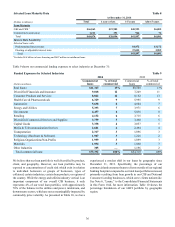
Commercial loans increased $9.1 billion, or 14%, during
2014 compared to December 31, 2013. C&I loans increased $7.5
billion, or 13%, from December 31, 2013, primarily driven by
broad-based growth generated by our corporate and commercial
banking businesses. The most notable increases were in the real
estate and diversified financials and insurance industry sectors.
The growth in C&I loans was partly offset by the transfer of $470
million of loans to LHFS in the fourth quarter of 2014. During
2014, CRE loans increased $1.3 billion, or 23%, compared to
December 31, 2013 reflecting growth in our institutional and