SunTrust 2014 Annual Report Download - page 135
Download and view the complete annual report
Please find page 135 of the 2014 SunTrust annual report below. You can navigate through the pages in the report by either clicking on the pages listed below, or by using the keyword search tool below to find specific information within the annual report.-
 1
1 -
2
-
3
-
4
-
5
-
6
-
7
-
8
-
9
-
10
-
11
-
12
-
13
-
14
-
15
-
16
-
17
-
18
-
19
-
20
-
21
-
22
-
23
-
24
-
25
-
26
-
27
-
28
-
29
-
30
-
31
-
32
-
33
-
34
-
35
-
36
-
37
-
38
-
39
-
40
-
41
-
42
-
43
-
44
-
45
-
46
-
47
-
48
-
49
-
50
-
51
-
52
-
53
-
54
-
55
-
56
-
57
-
58
-
59
-
60
-
61
-
62
-
63
-
64
-
65
-
66
-
67
-
68
-
69
-
70
-
71
-
72
-
73
-
74
-
75
-
76
-
77
-
78
-
79
-
80
-
81
-
82
-
83
-
84
-
85
-
86
-
87
-
88
-
89
-
90
-
91
-
92
-
93
-
94
-
95
-
96
-
97
-
98
-
99
-
100
-
101
-
102
-
103
-
104
-
105
-
106
-
107
-
108
-
109
-
110
-
111
-
112
-
113
-
114
-
115
-
116
-
117
-
118
-
119
-
120
-
121
-
122
-
123
-
124
-
 125
125 -
 126
126 -
 127
127 -
 128
128 -
 129
129 -
 130
130 -
 131
131 -
 132
132 -
 133
133 -
 134
134 -
 135
135 -
 136
136 -
 137
137 -
 138
138 -
 139
139 -
 140
140 -
 141
141 -
 142
142 -
 143
143 -
 144
144 -
 145
145 -
146
-
147
-
148
-
149
-
150
-
151
-
152
-
153
-
154
-
155
-
156
-
157
-
158
-
159
-
160
-
161
-
162
-
163
-
164
-
165
-
166
-
167
-
168
-
169
-
170
-
171
-
172
-
173
-
174
-
175
-
176
-
177
-
178
-
179
-
180
-
181
-
182
-
183
-
184
-
185
-
186
-
187
-
188
-
189
-
190
-
191
-
192
-
193
-
194
-
195
-
196
-
197
-
198
-
199
 |
 |
Notes to Consolidated Financial Statements, continued
112
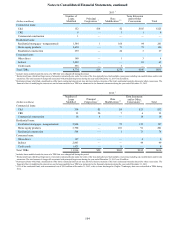
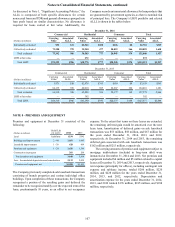
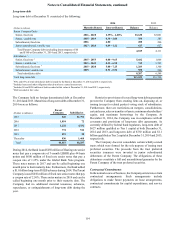
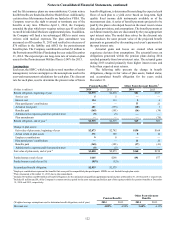
In relation to the Commercial, Residential and Consumer
financial assets discussed above, the following table presents
portfolio and delinquency balances for accruing loans 90 days
or more past due and all nonaccrual loans at December 31, 2014
and 2013, as well as net charge-offs for the years ended December
31, 2014 and 2013:
Portfolio Balance 1Past Due and Nonaccrual 2Net Charge-offs
December 31,
2014 December 31,
2013 December 31,
2014 December 31,
2013
Year Ended December 31
(Dollars in millions) 2014 2013
Type of loan:
Commercial $73,392 $64,310 $181 $272 $71 $153
Residential 38,775 43,190 891 1,296 279 444
Consumer 20,945 20,377 619 631 95 81
Total loan portfolio 133,112 127,877 1,691 2,199 445 678
Managed securitized loans:
Commercial —1,617 —29 ——
Residential 110,591 100,695 183 3493 316 23
Total managed loans $243,703 $230,189 $1,874 $2,721 $461 $701
1 Excludes $3.2 billion and $1.7 billion of LHFS at December 31, 2014 and 2013, respectively.
2 Excludes $39 million and $17 million of past due LHFS at December 31, 2014 and 2013, respectively.
3 Excludes loans that have completed the foreclosure or short sale process (i.e. involuntary prepayments).
Other Variable Interest Entities
In addition to the Company’s involvement with certain VIEs
related to transfers of financial assets, the Company also has
involvement with VIEs from other business activities.
Total Return Swaps
The Company has involvement with various VIEs related to its
TRS business. Under the matched book TRS business model,
the VIEs purchase assets (typically commercial leveraged loans)
from the market, which are identified by third party clients, that
serve as the underlying reference assets for a TRS between the
VIE and the Company and a mirror-image TRS between the
Company and its third party clients. The TRS contracts between
the VIEs and the Company hedge the Company’s exposure to
the TRS contracts with its third party clients. These third parties
are not related parties to the Company, nor are they and the
Company de facto agents of each other. In order for the VIEs to
purchase the reference assets, the Company provides senior
financing, in the form of demand notes, to these VIEs. The TRS
contracts pass through interest and other cash flows on the assets
owned by the VIEs to the third parties, along with exposing the
third parties to decreases in value on the assets and providing
them with the rights to appreciation on the assets. The terms of
the TRS contracts require the third parties to post initial
collateral, in addition to ongoing margin as the fair values of the
underlying assets change.
The Company evaluated the VIEs for consolidation, noting
that the Company and its third party clients are the VI holders.
As such, the Company evaluated the nature of all VIs and other
interests and involvement with the VIEs, in addition to the
purpose and design of the VIEs, relative to the risks they were
designed to create. The purpose and design of a VIE are key
components of a consolidation analysis. The VIEs were designed
for the benefit of the third parties and would not exist if the
Company did not enter into the TRS contracts with the third
parties. The activities of the VIEs are restricted to buying and
selling reference assets with respect to the TRS contracts entered
into between the Company and its third party clients and the
risks/benefits of any such assets owned by the VIEs are passed
to the third party clients via the TRS contracts. The TRS contracts
between the Company and its third party clients have a
substantive effect on the design of the overall transaction and the
VIEs. Based on its evaluation, the Company has determined that
it is not the primary beneficiary of the VIEs, as the design of the
TRS business results in the Company having no substantive
power to direct the significant activities of the VIEs.
At December 31, 2014 and 2013, the Company had $2.3
billion and $1.5 billion, respectively, in senior financing
outstanding to VIEs, which was classified within trading assets
and derivatives on the Consolidated Balance Sheets and carried
at fair value. These VIEs had entered into TRS contracts with
the Company with outstanding notional amounts of $2.3 billion
and $1.5 billion at December 31, 2014 and 2013, respectively,
and the Company had entered into mirror-image TRS contracts
with third parties with the same outstanding notional amounts.
At December 31, 2014, the fair values of these TRS assets and
liabilities were $19 million and $14 million, respectively, and at
December 31, 2013, the fair values of these TRS assets and
liabilities were $35 million and $31 million, respectively,
reflecting the pass-through nature of these structures. The
notional amounts of the TRS contracts with the VIEs represent
the Company’s maximum exposure to loss, although such
exposure to loss has been mitigated via the TRS contracts with
third parties. For additional information on the Company’s TRS
with these VIEs, see Note 17, “Derivative Financial
Instruments.”
Community Development Investments
As part of its community reinvestment initiatives, the Company
invests primarily within its footprint in multi-family affordable
housing developments and other community development
entities as a limited and/or general partner and/or a debt
provider. The Company receives tax credits for its limited partner
investments. The Company has determined that the vast majority
of the related partnerships in which the investments are held are