SunTrust 2014 Annual Report Download - page 89
Download and view the complete annual report
Please find page 89 of the 2014 SunTrust annual report below. You can navigate through the pages in the report by either clicking on the pages listed below, or by using the keyword search tool below to find specific information within the annual report.-
 1
1 -
2
-
3
-
4
-
5
-
6
-
7
-
8
-
9
-
10
-
11
-
12
-
13
-
14
-
15
-
16
-
17
-
18
-
19
-
20
-
21
-
22
-
23
-
24
-
25
-
26
-
27
-
28
-
29
-
30
-
31
-
32
-
33
-
34
-
35
-
36
-
37
-
38
-
39
-
40
-
41
-
42
-
43
-
44
-
45
-
46
-
47
-
48
-
49
-
50
-
51
-
52
-
53
-
54
-
55
-
56
-
57
-
58
-
59
-
60
-
61
-
62
-
63
-
64
-
65
-
66
-
67
-
68
-
69
-
70
-
71
-
72
-
73
-
74
-
75
-
76
-
77
-
78
-
 79
79 -
 80
80 -
 81
81 -
 82
82 -
 83
83 -
 84
84 -
 85
85 -
 86
86 -
 87
87 -
 88
88 -
 89
89 -
 90
90 -
 91
91 -
 92
92 -
 93
93 -
 94
94 -
 95
95 -
 96
96 -
 97
97 -
 98
98 -
 99
99 -
100
-
101
-
102
-
103
-
104
-
105
-
106
-
107
-
108
-
109
-
110
-
111
-
112
-
113
-
114
-
115
-
116
-
117
-
118
-
119
-
120
-
121
-
122
-
123
-
124
-
125
-
126
-
127
-
128
-
129
-
130
-
131
-
132
-
133
-
134
-
135
-
136
-
137
-
138
-
139
-
140
-
141
-
142
-
143
-
144
-
145
-
146
-
147
-
148
-
149
-
150
-
151
-
152
-
153
-
154
-
155
-
156
-
157
-
158
-
159
-
160
-
161
-
162
-
163
-
164
-
165
-
166
-
167
-
168
-
169
-
170
-
171
-
172
-
173
-
174
-
175
-
176
-
177
-
178
-
179
-
180
-
181
-
182
-
183
-
184
-
185
-
186
-
187
-
188
-
189
-
190
-
191
-
192
-
193
-
194
-
195
-
196
-
197
-
198
-
199
 |
 |

66
monitored as part of various governance processes. We
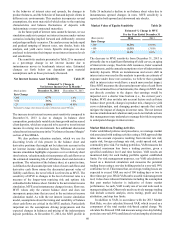
originated MSRs with fair values at the time of origination of
$178 million and $352 million during 2014 and 2013,
respectively. Additionally, we purchased servicing rights valued
at approximately $130 million during 2014. We recognized a
mark-to-market decrease of $401 million and an increase of $50
million in the fair value of our MSRs during 2014 and 2013,
respectively. Increases or decreases in fair value include the
decay resulting from the realization of expected monthly net
servicing cash flows. We recorded $134 million and $233 million
of net losses during 2014 and 2013, respectively, inclusive of
decay and related hedges. The decrease in net losses related to
MSRs during 2014 compared to 2013 was driven by lower decay,
which was a result of a decline in refinance activity due to higher
mortgage interest rates.
We also held a total net book value of approximately $9
million and $14 million of non-public equity exposures (direct
investments) and other equity-related investments at
December 31, 2014 and 2013, respectively. We generally hold
these investments as long-term investments. If conditions in the
market deteriorate, impairment charges could occur related to
these long-term investments and other assets, including but not
limited to goodwill and other intangible assets.
OFF-BALANCE SHEET ARRANGEMENTS
See discussion of off-balance sheet arrangements in Note 10,
“Certain Transfers of Financial Assets and Variable Interest
Entities,” and Note 16, “Guarantees,” to the Consolidated
Financial Statements in this Form 10-K.
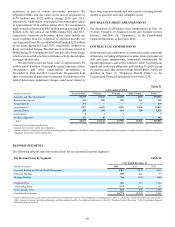
CONTRACTUAL COMMITMENTS
In the normal course of business, we enter into certain contractual
obligations, including obligations to make future payments on
debt and lease arrangements, contractual commitments for
capital expenditures, and service contracts. Table 31 presents our
significant contractual obligations at December 31, 2014, except
for pension and other postretirement benefit plans, which are
included in Note 15, "Employee Benefit Plans," to the
Consolidated Financial Statements in this Form 10-K.
Table 31
At December 31, 2014
(Dollars in millions) 1 year or less 1-3 years 3-5 years After 5 years Total
Consumer and other time deposits 1$5,295 $3,843 $1,278 $458 $10,874
Brokered time deposits 1162 289 296 211 958
Foreign deposits 375 — — — 375
Long-term debt 1, 2 1,817 6,687 2,205 2,304 13,013
Operating leases 205 384 194 328 1,111
Capital leases 12 3 4 — 9
Purchase obligations 3421 38 3 — 462
Total $8,277 $11,244 $3,980 $3,301 $26,802
1 Amounts do not include accrued interest.
2 Amounts do not include capital lease obligations.
3 Amounts represent termination fees for legally binding purchase obligations of $5 million or more. Payments made towards the purchase of goods or services under these purchase
obligations totaled $223 million during 2014.
BUSINESS SEGMENTS
The following table presents net income/(loss) for our reportable business segments:
Net Income/(Loss) by Segment Table 32
Year Ended December 31
(Dollars in millions) 2014 2013 2012
Consumer Banking and Private Wealth Management $687 $642 $349
Wholesale Banking 900 822 719
Mortgage Banking (56) (527) (605)
Corporate Other 436 519 1,542
Reconciling Items 1(193) (112) (47)
Total Corporate Other 243 407 1,495
Consolidated net income $1,774 $1,344 1,958
1 Includes differences between net income/(loss) reported for each business segment using management accounting practices and U.S. GAAP. Prior period information has been restated to
reflect changes in internal reporting methodology and inter-segment transfers. See additional information in Note 20, "Business Segment Reporting," to the Consolidated Financial
Statements in this Form 10-K.