SunTrust 2014 Annual Report Download - page 90
Download and view the complete annual report
Please find page 90 of the 2014 SunTrust annual report below. You can navigate through the pages in the report by either clicking on the pages listed below, or by using the keyword search tool below to find specific information within the annual report.-
 1
1 -
2
-
3
-
4
-
5
-
6
-
7
-
8
-
9
-
10
-
11
-
12
-
13
-
14
-
15
-
16
-
17
-
18
-
19
-
20
-
21
-
22
-
23
-
24
-
25
-
26
-
27
-
28
-
29
-
30
-
31
-
32
-
33
-
34
-
35
-
36
-
37
-
38
-
39
-
40
-
41
-
42
-
43
-
44
-
45
-
46
-
47
-
48
-
49
-
50
-
51
-
52
-
53
-
54
-
55
-
56
-
57
-
58
-
59
-
60
-
61
-
62
-
63
-
64
-
65
-
66
-
67
-
68
-
69
-
70
-
71
-
72
-
73
-
74
-
75
-
76
-
77
-
78
-
79
-
 80
80 -
 81
81 -
 82
82 -
 83
83 -
 84
84 -
 85
85 -
 86
86 -
 87
87 -
 88
88 -
 89
89 -
 90
90 -
 91
91 -
 92
92 -
 93
93 -
 94
94 -
 95
95 -
 96
96 -
 97
97 -
 98
98 -
 99
99 -
 100
100 -
101
-
102
-
103
-
104
-
105
-
106
-
107
-
108
-
109
-
110
-
111
-
112
-
113
-
114
-
115
-
116
-
117
-
118
-
119
-
120
-
121
-
122
-
123
-
124
-
125
-
126
-
127
-
128
-
129
-
130
-
131
-
132
-
133
-
134
-
135
-
136
-
137
-
138
-
139
-
140
-
141
-
142
-
143
-
144
-
145
-
146
-
147
-
148
-
149
-
150
-
151
-
152
-
153
-
154
-
155
-
156
-
157
-
158
-
159
-
160
-
161
-
162
-
163
-
164
-
165
-
166
-
167
-
168
-
169
-
170
-
171
-
172
-
173
-
174
-
175
-
176
-
177
-
178
-
179
-
180
-
181
-
182
-
183
-
184
-
185
-
186
-
187
-
188
-
189
-
190
-
191
-
192
-
193
-
194
-
195
-
196
-
197
-
198
-
199
 |
 |

67
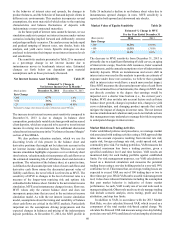
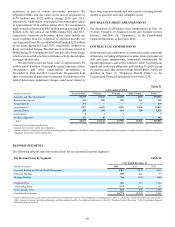
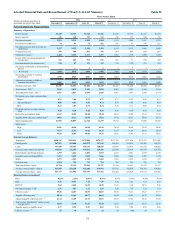
The following table presents average loans and average deposits for our reportable business segments during the years ended
December 31:
Average Loans and Deposits by Segment Table 33
Average Loans Average Consumer
and Commercial Deposits
(Dollars in millions) 2014 2013 2012 2014 2013 2012
Consumer Banking and Private Wealth Management $41,694 $40,511 $41,822 $86,249 $84,359 $83,903
Wholesale Banking 62,643 54,141 50,742 43,502 39,577 38,712
Mortgage Banking 26,494 27,974 30,288 2,333 3,206 3,638
Corporate Other 43 31 41 (72) (66) (4)
See Note 20, “Business Segment Reporting,” to the Consolidated
Financial Statements in this Form 10-K for a discussion of our
segment structure, basis of presentation, and internal
management reporting methodologies, including the
reclassification of RidgeWorth results from the Wholesale
Banking segment to Corporate Other during 2014.
BUSINESS SEGMENT RESULTS
Year Ended December 31, 2014 vs. 2013
Consumer Banking and Private Wealth Management
Consumer Banking and Private Wealth Management reported
net income of $687 million during the year ended December 31,
2014, an increase of $45 million, or 7%, compared to 2013. The
increase in net income was primarily driven by continued
improvement in credit quality resulting in lower credit losses and
an increase in noninterest income, which in aggregate more than
offset a 3% increase in expenses.
Net interest income was $2.6 billion, an increase of $37
million compared to 2013, driven by increased average asset and
deposit balances, partially offset by lower rate spreads. Net
interest income related to loans increased $3 million, driven by
a $1.2 billion increase in average loan balances, partially offset
by a six basis point decrease in loan spreads. The increase in
average loans was driven by growth in consumer loans, which
more than offset home equity line paydowns and a decline in
nonaccrual loans. Net interest income related to deposits
increased $16 million, or 1%, driven by $1.9 billion, or 2%,
increase in average deposit balances, partially offset by a three
basis point decrease in deposit spreads. However, favorable
deposit mix trends continued as average deposit balances
increased in all lower cost account categories, offsetting a $2.0
billion, or 15%, decline in average time deposits. Other funding
costs related to other assets improved by $19 million, driven
primarily by a decline in funding rates.
Provision for credit losses was $191 million, a decrease of
$70 million, or 27%, compared to 2013. The decrease was
primarily driven by declines in home equity line and commercial
loan net charge-offs, partially offset by an increase in
nonguaranteed student loan net charge-offs.
Total noninterest income was $1.5 billion, an increase of
$50 million, or 3%, compared to 2013, driven by an increase in
retail investment income, trust and investment management, and
card fees income, partially offset by a decrease in service charges
on deposits.
Total noninterest expense was $2.9 billion, an increase of
$86 million, or 3%, compared to 2013. The increase was driven
by higher staff expenses related to investment in revenue
generating positions, primarily in wealth management-related
businesses to help fulfill more of our clients’ wealth and
investment management needs. Additionally, higher operating
losses and allocated corporate overhead costs were partially
offset by a decrease in other operating expenses.
Wholesale Banking
Wholesale Banking reported net income of $900 million for the
year ended December 31, 2014, an increase of $78 million, or
9%, compared to 2013. The increase in net income was
attributable to an increase in net interest income and a decrease
in provision for credit losses, partially offset by an increase in
noninterest expense.
Net interest income was $1.8 billion, a $131 million, or 8%,
increase compared to 2013, driven by increases in average loan
and deposit balances, partially offset by lower rate spreads. Net
interest income related to loans increased, as average loan
balances grew $8.5 billion, or 16%, led by C&I, CRE, and tax-
exempt loans. Net interest income related to client deposits
increased as average deposit balances grew $3.9 billion, or 10%,
compared to the same period in 2013. Lower cost demand
deposits increased $1.8 billion, or 9%, and average combined
interest-bearing transaction accounts and money market
accounts increased $2.3 billion, or 12%, while average CD
balances declined approximately $147 million.
Provision for credit losses was $71 million, a decrease of
$53 million, or 43%, from the same period in 2013. The decline
reflects the continued improvement in overall Wholesale
Banking credit quality and a $56 million decline in net charge-
offs, partially offset by an increase in the provision for credit
losses recorded in the fourth quarter of 2014 related to the recent
decline in oil prices.
Total noninterest income was $1.1 billion and virtually
unchanged compared to 2013. A $49 million, or 14%, increase
in investment banking income along with higher structured real
estate gains, card fees, and non margin loan fees was largely
offset by declines in affordable housing partnership revenue and
related gains driven by the sale of certain affordable housing
properties. Additionally, trading revenue and service charges on
treasury related services declined, and impairment charges
related to aircraft leases increased during 2014.
Total noninterest expense was $1.5 billion, an increase of
$86 million or 6%, compared to 2013. The increase was primarily
due to an increase in employee compensation as we continue to