SunTrust 2014 Annual Report Download - page 105
Download and view the complete annual report
Please find page 105 of the 2014 SunTrust annual report below. You can navigate through the pages in the report by either clicking on the pages listed below, or by using the keyword search tool below to find specific information within the annual report.-
 1
1 -
2
-
3
-
4
-
5
-
6
-
7
-
8
-
9
-
10
-
11
-
12
-
13
-
14
-
15
-
16
-
17
-
18
-
19
-
20
-
21
-
22
-
23
-
24
-
25
-
26
-
27
-
28
-
29
-
30
-
31
-
32
-
33
-
34
-
35
-
36
-
37
-
38
-
39
-
40
-
41
-
42
-
43
-
44
-
45
-
46
-
47
-
48
-
49
-
50
-
51
-
52
-
53
-
54
-
55
-
56
-
57
-
58
-
59
-
60
-
61
-
62
-
63
-
64
-
65
-
66
-
67
-
68
-
69
-
70
-
71
-
72
-
73
-
74
-
75
-
76
-
77
-
78
-
79
-
80
-
81
-
82
-
83
-
84
-
85
-
86
-
87
-
88
-
89
-
90
-
91
-
92
-
93
-
94
-
 95
95 -
 96
96 -
 97
97 -
 98
98 -
 99
99 -
 100
100 -
 101
101 -
 102
102 -
 103
103 -
 104
104 -
 105
105 -
 106
106 -
 107
107 -
 108
108 -
 109
109 -
 110
110 -
 111
111 -
 112
112 -
 113
113 -
 114
114 -
 115
115 -
116
-
117
-
118
-
119
-
120
-
121
-
122
-
123
-
124
-
125
-
126
-
127
-
128
-
129
-
130
-
131
-
132
-
133
-
134
-
135
-
136
-
137
-
138
-
139
-
140
-
141
-
142
-
143
-
144
-
145
-
146
-
147
-
148
-
149
-
150
-
151
-
152
-
153
-
154
-
155
-
156
-
157
-
158
-
159
-
160
-
161
-
162
-
163
-
164
-
165
-
166
-
167
-
168
-
169
-
170
-
171
-
172
-
173
-
174
-
175
-
176
-
177
-
178
-
179
-
180
-
181
-
182
-
183
-
184
-
185
-
186
-
187
-
188
-
189
-
190
-
191
-
192
-
193
-
194
-
195
-
196
-
197
-
198
-
199
 |
 |

82
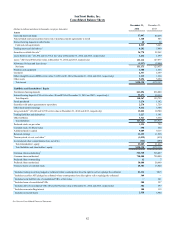
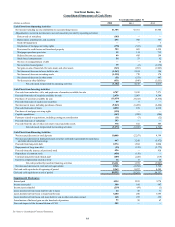
SunTrust Banks, Inc.
Consolidated Balance Sheets
December 31, December 31,
(Dollars in millions and shares in thousands, except per share data) 2014 2013
Assets
Cash and due from banks $7,047 $4,258
Federal funds sold and securities borrowed or purchased under agreements to resell 1,160 983
Interest-bearing deposits in other banks 22 22
Cash and cash equivalents 8,229 5,263
Trading assets and derivatives 16,202 5,040
Securities available for sale 226,770 22,542
Loans held for sale 3 ($1,892 and $1,378 at fair value at December 31, 2014 and 2013, respectively) 3,232 1,699
Loans 4 ($272 and $302 at fair value at December 31, 2014 and 2013, respectively) 133,112 127,877
Allowance for loan and lease losses (1,937) (2,044)
Net loans 131,175 125,833
Premises and equipment 1,508 1,565
Goodwill 6,337 6,369
Other intangible assets (MSRs at fair value: $1,206 and $1,300 at December 31, 2014 and 2013, respectively) 1,219 1,334
Other assets 5,656 5,690
Total assets $190,328 $175,335
Liabilities and Shareholders’ Equity
Noninterest-bearing deposits $41,096 $38,800
Interest-bearing deposits (CDs at fair value: $0 and $764 at December 31, 2014 and 2013, respectively) 99,471 90,959
Total deposits 140,567 129,759
Funds purchased 1,276 1,192
Securities sold under agreements to repurchase 2,276 1,759
Other short-term borrowings 5,634 5,788
Long-term debt 5 ($1,283 and $1,556 at fair value at December 31, 2014 and 2013, respectively) 13,022 10,700
Trading liabilities and derivatives 1,227 1,181
Other liabilities 3,321 3,534
Total liabilities 167,323 153,913
Preferred stock, no par value 1,225 725
Common stock, $1.00 par value 550 550
Additional paid in capital 9,089 9,115
Retained earnings 13,295 11,936
Treasury stock, at cost, and other 6(1,032) (615)
Accumulated other comprehensive loss, net of tax (122) (289)
Total shareholders’ equity 23,005 21,422
Total liabilities and shareholders’ equity $190,328 $175,335
Common shares outstanding 7524,540 536,097
Common shares authorized 750,000 750,000
Preferred shares outstanding 12 7
Preferred shares authorized 50,000 50,000
Treasury shares of common stock 25,381 13,824
1 Includes trading securities pledged as collateral where counterparties have the right to sell or repledge the collateral $1,316 $815
2 Includes securities AFS pledged as collateral where counterparties have the right to sell or repledge the collateral 369 —
3 Includes loans held for sale of consolidated VIEs, at fair value —261
4 Includes loans of consolidated VIEs 288 327
5 Includes debt of consolidated VIEs ($0 and $256 at fair value at December 31, 2014 and 2013, respectively) 302 597
6 Includes noncontrolling interest 108 119
7 Includes restricted shares 2,930 3,984
See Notes to Consolidated Financial Statements.