SunTrust 2014 Annual Report Download - page 164
Download and view the complete annual report
Please find page 164 of the 2014 SunTrust annual report below. You can navigate through the pages in the report by either clicking on the pages listed below, or by using the keyword search tool below to find specific information within the annual report.-
 1
1 -
2
-
3
-
4
-
5
-
6
-
7
-
8
-
9
-
10
-
11
-
12
-
13
-
14
-
15
-
16
-
17
-
18
-
19
-
20
-
21
-
22
-
23
-
24
-
25
-
26
-
27
-
28
-
29
-
30
-
31
-
32
-
33
-
34
-
35
-
36
-
37
-
38
-
39
-
40
-
41
-
42
-
43
-
44
-
45
-
46
-
47
-
48
-
49
-
50
-
51
-
52
-
53
-
54
-
55
-
56
-
57
-
58
-
59
-
60
-
61
-
62
-
63
-
64
-
65
-
66
-
67
-
68
-
69
-
70
-
71
-
72
-
73
-
74
-
75
-
76
-
77
-
78
-
79
-
80
-
81
-
82
-
83
-
84
-
85
-
86
-
87
-
88
-
89
-
90
-
91
-
92
-
93
-
94
-
95
-
96
-
97
-
98
-
99
-
100
-
101
-
102
-
103
-
104
-
105
-
106
-
107
-
108
-
109
-
110
-
111
-
112
-
113
-
114
-
115
-
116
-
117
-
118
-
119
-
120
-
121
-
122
-
123
-
124
-
125
-
126
-
127
-
128
-
129
-
130
-
131
-
132
-
133
-
134
-
135
-
136
-
137
-
138
-
139
-
140
-
141
-
142
-
143
-
144
-
145
-
146
-
147
-
148
-
149
-
150
-
151
-
152
-
153
-
 154
154 -
 155
155 -
 156
156 -
 157
157 -
 158
158 -
 159
159 -
 160
160 -
 161
161 -
 162
162 -
 163
163 -
 164
164 -
 165
165 -
 166
166 -
 167
167 -
 168
168 -
 169
169 -
 170
170 -
 171
171 -
 172
172 -
 173
173 -
 174
174 -
175
-
176
-
177
-
178
-
179
-
180
-
181
-
182
-
183
-
184
-
185
-
186
-
187
-
188
-
189
-
190
-
191
-
192
-
193
-
194
-
195
-
196
-
197
-
198
-
199
 |
 |

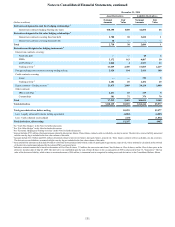
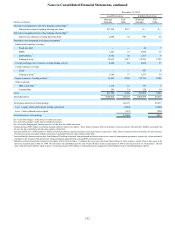
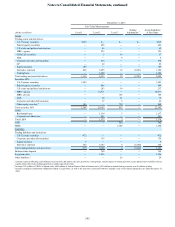
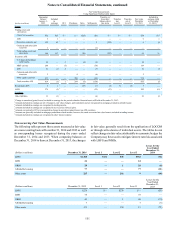
Notes to Consolidated Financial Statements, continued
141
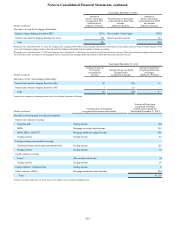
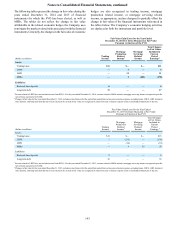
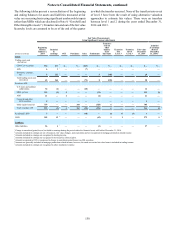
December 31, 2013
Fair Value Measurements
(Dollars in millions) Level 1 Level 2 Level 3 Netting
Adjustments 1Assets/Liabilities
at Fair Value
Assets
Trading assets and derivatives:
U.S. Treasury securities $219 $— $— $— $219
Federal agency securities — 426 — — 426
U.S. states and political subdivisions — 65 — — 65
MBS - agency — 323 — — 323
CDO/CLO securities — 3 54 — 57
ABS — — 6 — 6
Corporate and other debt securities — 534 — — 534
CP — 29 — — 29
Equity securities 109 — — — 109
Derivative contracts 828 5,285 12 (4,741) 1,384
Trading loans — 1,888 — — 1,888
Total trading assets and derivatives 1,156 8,553 72 (4,741) 5,040
Securities AFS:
U.S. Treasury securities 1,293 — — — 1,293
Federal agency securities — 984 — — 984
U.S. states and political subdivisions — 203 34 — 237
MBS - agency — 18,911 — — 18,911
MBS - private — — 154 — 154
ABS — 58 21 — 79
Corporate and other debt securities — 37 5 — 42
Other equity securities 2103 — 739 — 842
Total securities AFS 1,396 20,193 953 — 22,542
LHFS:
Residential loans — 1,114 3 — 1,117
Corporate and other loans — 261 — — 261
Total LHFS — 1,375 3 — 1,378
LHFI — — 302 — 302
MSRs — — 1,300 — 1,300
Liabilities
Trading liabilities and derivatives:
U.S. Treasury securities 472 — — — 472
Corporate and other debt securities — 179 — — 179
Equity securities 5 — — — 5
Derivative contracts 502 5,167 4 (5,148) 525
Total trading liabilities and derivatives 979 5,346 4 (5,148) 1,181
Brokered time deposits — 764 — — 764
Long-term debt — 1,556 — — 1,556
Other liabilities 3— — 29 — 29
1 Amounts represent offsetting cash collateral received from, and paid to, the same derivative counterparties, and the impact of netting derivative assets and derivative liabilities when a
legally enforceable master netting agreement or similar agreement exists.
2 Includes $336 million of FHLB of Atlanta stock, $402 million of Federal Reserve Bank of Atlanta stock, $103 million in mutual fund investments, and $1 million of other.
3 Includes contingent consideration obligations related to acquisitions, as well as the derivative associated with the Company's sale of Visa shares during the year ended December 31,
2009.