SunTrust 2014 Annual Report Download - page 167
Download and view the complete annual report
Please find page 167 of the 2014 SunTrust annual report below. You can navigate through the pages in the report by either clicking on the pages listed below, or by using the keyword search tool below to find specific information within the annual report.-
 1
1 -
2
-
3
-
4
-
5
-
6
-
7
-
8
-
9
-
10
-
11
-
12
-
13
-
14
-
15
-
16
-
17
-
18
-
19
-
20
-
21
-
22
-
23
-
24
-
25
-
26
-
27
-
28
-
29
-
30
-
31
-
32
-
33
-
34
-
35
-
36
-
37
-
38
-
39
-
40
-
41
-
42
-
43
-
44
-
45
-
46
-
47
-
48
-
49
-
50
-
51
-
52
-
53
-
54
-
55
-
56
-
57
-
58
-
59
-
60
-
61
-
62
-
63
-
64
-
65
-
66
-
67
-
68
-
69
-
70
-
71
-
72
-
73
-
74
-
75
-
76
-
77
-
78
-
79
-
80
-
81
-
82
-
83
-
84
-
85
-
86
-
87
-
88
-
89
-
90
-
91
-
92
-
93
-
94
-
95
-
96
-
97
-
98
-
99
-
100
-
101
-
102
-
103
-
104
-
105
-
106
-
107
-
108
-
109
-
110
-
111
-
112
-
113
-
114
-
115
-
116
-
117
-
118
-
119
-
120
-
121
-
122
-
123
-
124
-
125
-
126
-
127
-
128
-
129
-
130
-
131
-
132
-
133
-
134
-
135
-
136
-
137
-
138
-
139
-
140
-
141
-
142
-
143
-
144
-
145
-
146
-
147
-
148
-
149
-
150
-
151
-
152
-
153
-
154
-
155
-
156
-
 157
157 -
 158
158 -
 159
159 -
 160
160 -
 161
161 -
 162
162 -
 163
163 -
 164
164 -
 165
165 -
 166
166 -
 167
167 -
 168
168 -
 169
169 -
 170
170 -
 171
171 -
 172
172 -
 173
173 -
 174
174 -
 175
175 -
 176
176 -
 177
177 -
178
-
179
-
180
-
181
-
182
-
183
-
184
-
185
-
186
-
187
-
188
-
189
-
190
-
191
-
192
-
193
-
194
-
195
-
196
-
197
-
198
-
199
 |
 |

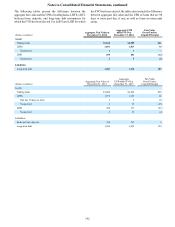
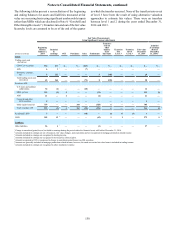
Notes to Consolidated Financial Statements, continued
144
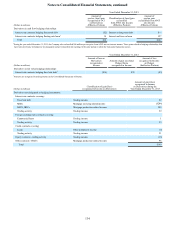
Fair Value Gain/(Loss) for the Year Ended
December 31, 2012, for Items Measured at Fair Value
Pursuant to Election of the FVO
(Dollars in millions) Trading
income
Mortgage
Production
Related
Income 1
Mortgage
Servicing
Related
Income
Total Changes
in Fair Values
Included in
Current Period
Earnings 2
Assets:
Trading loans $8 $— $— $8
LHFS 10 161 — 171
LHFI 1 20 — 21
MSRs — 31 (353) (322)
Liabilities:
Brokered time deposits 5 — — 5
Long-term debt (65) — — (65)
1 Income related to LHFS does not include income from IRLCs. For the year ended December 31, 2012, income related to MSRs includes mortgage servicing income recognized upon the
sale of loans reported at LOCOM.
2 Changes in fair value for the year ended December 31, 2012 exclude accrued interest for the period then ended. Interest income or interest expense on trading loans, LHFS, LHFI, brokered
time deposits, and long-term debt that have been elected to be carried at fair value are recognized in interest income or interest expense in the Consolidated Statements of Income.
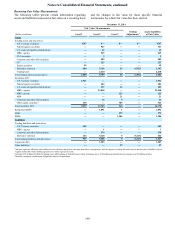
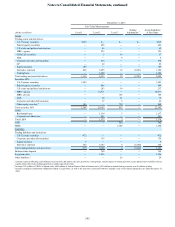
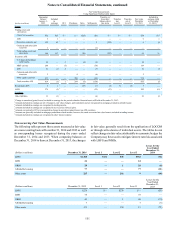
The following is a discussion of the valuation techniques and
inputs used in developing fair value measurements for assets
and liabilities classified as level 2 or 3 that are measured at fair
value on a recurring basis, based on the class of asset or liability
as determined by the nature and risks of the instrument.
Trading Assets and Derivatives and Securities Available for Sale
Unless otherwise indicated, trading assets are priced by the
trading desk and securities AFS are valued by an independent
third party pricing service.
Federal agency securities
The Company includes in this classification securities issued by
federal agencies and GSEs. Agency securities consist of debt
obligations issued by HUD, FHLB, and other agencies or
collateralized by loans that are guaranteed by the SBA and are,
therefore, backed by the full faith and credit of the U.S.
government. For SBA instruments, the Company estimated fair
value based on pricing from observable trading activity for
similar securities or obtained fair values from a third party
pricing service. Accordingly, the Company has classified these
instruments as level 2.
U.S. states and political subdivisions
The Company’s investments in U.S. states and political
subdivisions (collectively “municipals”) include obligations of
county and municipal authorities and agency bonds, which are
general obligations of the municipality or are supported by a
specified revenue source. Holdings were geographically
dispersed, with no significant concentrations in any one state or
municipality. Additionally, all but an immaterial amount of AFS
municipal obligations classified as level 2 are highly rated or
are otherwise collateralized by securities backed by the full faith
and credit of the federal government.
Level 3 AFS municipal securities at December 31, 2014
includes bonds that are only redeemable with the issuer at par
and cannot be traded in the market. As such, no significant
observable market data for these instruments is available. To
estimate pricing on these securities, the Company utilized a third
party municipal bond yield curve for the lowest investment
grade bonds and priced each bond based on the yield associated
with that maturity.
Level 3 AFS municipal securities at December 31, 2013
includes ARS purchased since the auction rate market began
failing in February 2008 and have been considered level 3
securities due to the significant decrease in the volume and level
of activity in these markets, which has necessitated the use of
significant unobservable inputs into the Company’s valuations.
These securities were valued based on comparisons to similar
ARS for which auctions are currently successful and/or to longer
term, non-ARS issued by similar municipalities. The Company
also evaluated the relative strength of the municipality and made
appropriate downward adjustments in price based on the credit
rating of the municipality, as well as the relative financial
strength of the insurer on those bonds. Although auctions for
several municipal ARS have been operating successfully, ARS
owned by the Company at December 31, 2013 were classified
as level 3 as they were ARS for which the auctions continued
to fail. Accordingly, due to the uncertainty around the success
rates for auctions, and the absence of any successful auctions
for these identical securities, the Company priced the ARS
below par. Subsequent to December 31, 2013, the Company sold
these remaining ARS securities.
MBS – agency
Agency MBS includes pass-through securities and
collateralized mortgage obligations issued by GSEs and U.S.
government agencies, such as Fannie Mae, Freddie Mac, and
Ginnie Mae. Each security contains a guarantee by the issuing
GSE or agency. For agency MBS, the Company estimated fair
value based on pricing from observable trading activity for
similar securities or obtained fair values from a third party
pricing service; accordingly, the Company has classified these
instruments as level 2.
MBS – private
Private MBS includes purchased interests in third party
securitizations, as well as retained interests in Company-
sponsored securitizations of 2006 and 2007 vintage residential
mortgages; including both prime jumbo fixed rate collateral and
floating rate collateral. At the time of purchase or origination,