SunTrust 2014 Annual Report Download - page 62
Download and view the complete annual report
Please find page 62 of the 2014 SunTrust annual report below. You can navigate through the pages in the report by either clicking on the pages listed below, or by using the keyword search tool below to find specific information within the annual report.-
 1
1 -
2
-
3
-
4
-
5
-
6
-
7
-
8
-
9
-
10
-
11
-
12
-
13
-
14
-
15
-
16
-
17
-
18
-
19
-
20
-
21
-
22
-
23
-
24
-
25
-
26
-
27
-
28
-
29
-
30
-
31
-
32
-
33
-
34
-
35
-
36
-
37
-
38
-
39
-
40
-
41
-
42
-
43
-
44
-
45
-
46
-
47
-
48
-
49
-
50
-
51
-
 52
52 -
 53
53 -
 54
54 -
 55
55 -
 56
56 -
 57
57 -
 58
58 -
 59
59 -
 60
60 -
 61
61 -
 62
62 -
 63
63 -
 64
64 -
 65
65 -
 66
66 -
 67
67 -
 68
68 -
 69
69 -
 70
70 -
 71
71 -
 72
72 -
73
-
74
-
75
-
76
-
77
-
78
-
79
-
80
-
81
-
82
-
83
-
84
-
85
-
86
-
87
-
88
-
89
-
90
-
91
-
92
-
93
-
94
-
95
-
96
-
97
-
98
-
99
-
100
-
101
-
102
-
103
-
104
-
105
-
106
-
107
-
108
-
109
-
110
-
111
-
112
-
113
-
114
-
115
-
116
-
117
-
118
-
119
-
120
-
121
-
122
-
123
-
124
-
125
-
126
-
127
-
128
-
129
-
130
-
131
-
132
-
133
-
134
-
135
-
136
-
137
-
138
-
139
-
140
-
141
-
142
-
143
-
144
-
145
-
146
-
147
-
148
-
149
-
150
-
151
-
152
-
153
-
154
-
155
-
156
-
157
-
158
-
159
-
160
-
161
-
162
-
163
-
164
-
165
-
166
-
167
-
168
-
169
-
170
-
171
-
172
-
173
-
174
-
175
-
176
-
177
-
178
-
179
-
180
-
181
-
182
-
183
-
184
-
185
-
186
-
187
-
188
-
189
-
190
-
191
-
192
-
193
-
194
-
195
-
196
-
197
-
198
-
199
 |
 |

39
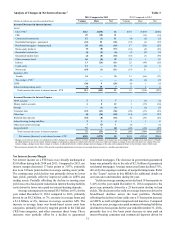
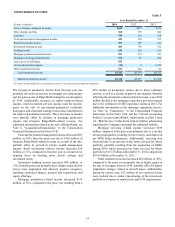
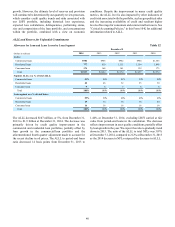
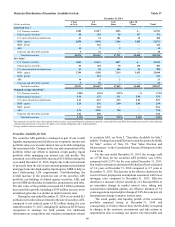
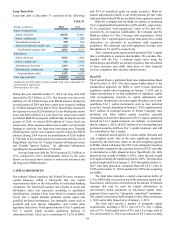
ALLOWANCE FOR CREDIT LOSSES
The allowance for credit losses consists of the ALLL and the
reserve for unfunded commitments. A rollforward of our
allowance for credit losses and summarized credit loss
experience is shown in Table 11. See Note 1, "Significant
Accounting Policies," and Note 7, "Allowance for Credit
Losses," to the Consolidated Financial Statements in this Form
10-K, as well as the "Allowance for Credit Losses" section within
"Critical Accounting Policies" in this MD&A for further
information regarding our ALLL accounting policy,
determination, and allocation.
Summary of Credit Losses Experience Table 11
Year Ended December 31
(Dollars in millions) 2014 2013 2012 2011 2010
Allowance for Credit Losses
Balance - beginning of period $2,094 $2,219 $2,505 $3,032 $3,235
Allowance recorded upon VIE consolidation —— — — 1
Provision/(benefit) for unfunded commitments 45 (3) (10) (57)
Provision for loan losses:
Commercial loans 111 197 241 324 938
Residential loans 126 243 1,062 1,113 1,622
Consumer loans 101 108 95 86 148
Total provision for loan losses 338 548 1,398 1,523 2,708
Charge-offs:
Commercial loans (128) (219) (457) (803) (1,087)
Residential loans (344) (531) (1,316) (1,275) (1,736)
Consumer loans (135) (119) (134) (163) (195)
Total charge-offs (607) (869) (1,907) (2,241) (3,018)
Recoveries:
Commercial loans 57 66 154 140 99
Residential loans 65 87 31 18 20
Consumer loans 40 38 41 43 44
Total recoveries 162 191 226 201 163
Net charge-offs (445) (678) (1,681) (2,040) (2,855)
Balance - end of period $1,991 $2,094 $2,219 $2,505 $3,032
Components:
ALLL $1,937 $2,044 $2,174 $2,457 $2,974
Unfunded commitments reserve 154 50 45 48 58
Allowance for credit losses $1,991 $2,094 $2,219 $2,505 $3,032
Average loans $130,874 $122,657 $122,893 $116,308 $113,925
Period-end loans outstanding 133,112 127,877 121,470 122,495 115,975
Ratios:
ALLL to period-end loans 2,3 1.46% 1.60% 1.80% 2.01% 2.58%
ALLL to NPLs 4307 212 142 85 73
ALLL to net charge-offs 4.35x 3.01x 1.29x 1.20x 1.04x
Net charge-offs to average loans 0.34% 0.55% 1.37% 1.75% 2.51%
1 The unfunded commitments reserve is recorded in other liabilities in the Consolidated Balance Sheets.
2 $272 million, $302 million, $379 million, $433 million, and $492 million of LHFI carried at fair value at December 31, 2014, 2013, 2012, 2011, and 2010, respectively, were excluded
from period-end loans in the calculation, as no allowance is recorded for loans held at fair value. We believe that this presentation more appropriately reflects the relationship between the
ALLL and loans that attract an allowance.
3 Excluding government-guaranteed loans of $5.5 billion, $9.0 billion, $9.6 billion, $13.9 billion, and $8.8 billion at December 31, 2014, 2013, 2012, 2011, and 2010, respectively, from
period-end loans in the calculation results in ratios of 1.52%, 1.72%, 1.95%, 2.27%, and $2.79%, respectively.
4 $3 million, $7 million, $19 million, $25 million, and $28 million of NPLs carried at fair value at December 31, 2014, 2013, 2012, 2011, and 2010, respectively, were excluded from NPLs
in the calculation.
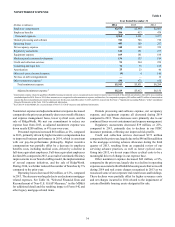
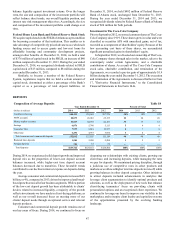
Provision for Credit Losses
The total provision for credit losses includes the provision for
loan losses and the provision for unfunded commitments. The
provision for loan losses is the result of a detailed analysis
performed to estimate an appropriate and adequate ALLL.
During 2014, the provision for loan losses decreased $210
million, or 38%, compared to 2013. The decline in the provision
for loan losses was largely attributable to improvements in credit
quality trends, particularly in our residential and CRE portfolios,
and lower net charge-offs during 2014 compared to 2013. The
decrease was partially offset by the effects of loan growth in the
commercial and consumer loan portfolios and an adjustment
made in the fourth quarter of 2014 to account for the recent
decline in oil prices.
We expect our provision for loan losses in 2015 to be
relatively stable to down slightly from 2014, as continued
improvement in asset quality may be partially offset by loan