SunTrust 2014 Annual Report Download - page 119
Download and view the complete annual report
Please find page 119 of the 2014 SunTrust annual report below. You can navigate through the pages in the report by either clicking on the pages listed below, or by using the keyword search tool below to find specific information within the annual report.-
 1
1 -
2
-
3
-
4
-
5
-
6
-
7
-
8
-
9
-
10
-
11
-
12
-
13
-
14
-
15
-
16
-
17
-
18
-
19
-
20
-
21
-
22
-
23
-
24
-
25
-
26
-
27
-
28
-
29
-
30
-
31
-
32
-
33
-
34
-
35
-
36
-
37
-
38
-
39
-
40
-
41
-
42
-
43
-
44
-
45
-
46
-
47
-
48
-
49
-
50
-
51
-
52
-
53
-
54
-
55
-
56
-
57
-
58
-
59
-
60
-
61
-
62
-
63
-
64
-
65
-
66
-
67
-
68
-
69
-
70
-
71
-
72
-
73
-
74
-
75
-
76
-
77
-
78
-
79
-
80
-
81
-
82
-
83
-
84
-
85
-
86
-
87
-
88
-
89
-
90
-
91
-
92
-
93
-
94
-
95
-
96
-
97
-
98
-
99
-
100
-
101
-
102
-
103
-
104
-
105
-
106
-
107
-
108
-
 109
109 -
 110
110 -
 111
111 -
 112
112 -
 113
113 -
 114
114 -
 115
115 -
 116
116 -
 117
117 -
 118
118 -
 119
119 -
 120
120 -
 121
121 -
 122
122 -
 123
123 -
 124
124 -
 125
125 -
 126
126 -
 127
127 -
 128
128 -
 129
129 -
130
-
131
-
132
-
133
-
134
-
135
-
136
-
137
-
138
-
139
-
140
-
141
-
142
-
143
-
144
-
145
-
146
-
147
-
148
-
149
-
150
-
151
-
152
-
153
-
154
-
155
-
156
-
157
-
158
-
159
-
160
-
161
-
162
-
163
-
164
-
165
-
166
-
167
-
168
-
169
-
170
-
171
-
172
-
173
-
174
-
175
-
176
-
177
-
178
-
179
-
180
-
181
-
182
-
183
-
184
-
185
-
186
-
187
-
188
-
189
-
190
-
191
-
192
-
193
-
194
-
195
-
196
-
197
-
198
-
199
 |
 |

Notes to Consolidated Financial Statements, continued
96
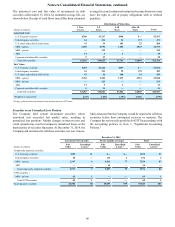
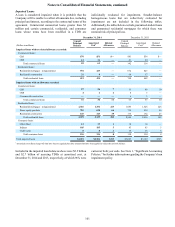
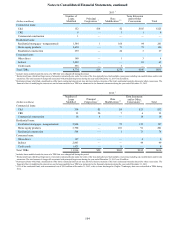
The amortized cost and fair value of investments in debt
securities at December 31, 2014, by estimated average life, are
shown below. Receipt of cash flows may differ from estimated
average lives and contractual maturities because borrowers may
have the right to call or prepay obligations with or without
penalties.
Distribution of Maturities
(Dollars in millions) 1 Year
or Less 1-5
Years 5-10
Years After 10
Years Total
Amortized Cost:
U.S. Treasury securities $200 $1,217 $496 $— $1,913
Federal agency securities 64 234 36 137 471
U.S. states and political subdivisions 43 34 101 22 200
MBS - agency 2,550 8,992 7,106 3,925 22,573
MBS - private — 122 — — 122
ABS 14 3 2 — 19
Corporate and other debt securities 5 33 — — 38
Total debt securities $2,876 $10,635 $7,741 $4,084 $25,336
Fair Value:
U.S. Treasury securities $203 $1,221 $497 $— $1,921
Federal agency securities 64 244 38 138 484
U.S. states and political subdivisions 43 36 106 24 209
MBS - agency 2,704 9,202 7,219 3,923 23,048
MBS - private — 123 — — 123
ABS 14 5 2 — 21
Corporate and other debt securities 5 36 — — 41
Total debt securities $3,033 $10,867 $7,862 $4,085 $25,847
Weighted average yield 12.34% 2.40% 2.78% 2.90% 2.59%
1Average yields are based on amortized cost and presented on a FTE basis.
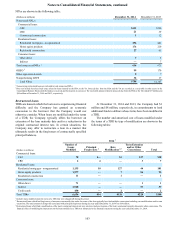
Securities in an Unrealized Loss Position
The Company held certain investment securities where
amortized cost exceeded fair market value, resulting in
unrealized loss positions. Market changes in interest rates and
credit spreads may result in temporary unrealized losses as the
market price of securities fluctuates. At December 31, 2014, the
Company did not intend to sell these securities nor was it more-
likely-than-not that the Company would be required to sell these
securities before their anticipated recovery or maturity. The
Company has reviewed its portfolio for OTTI in accordance with
the accounting policies in Note 1, "Significant Accounting
Policies."
December 31, 2014
Less than twelve months Twelve months or longer Total
(Dollars in millions) Fair
Value Unrealized
Losses 2Fair
Value Unrealized
Losses 2Fair
Value Unrealized
Losses 2
Temporarily impaired securities:
U.S. Treasury securities $150 $1 $— $— $150 $1
Federal agency securities 20 — 132 2 152 2
MBS - agency 2,347 6 4,911 77 7,258 83
ABS — — 14 — 14 —
Total temporarily impaired securities 2,517 7 5,057 79 7,574 86
OTTI securities 1:
MBS - private 69 1 — — 69 1
Total OTTI securities 69 1 — — 69 1
Total impaired securities $2,586 $8 $5,057 $79 $7,643 $87